Tlingit-Haida vs Sudanese 10th Grade
COMPARE
Tlingit-Haida
Sudanese
10th Grade
10th Grade Comparison
Tlingit-Haida
Sudanese
95.7%
10TH GRADE
100.0/ 100
METRIC RATING
12th/ 347
METRIC RANK
93.6%
10TH GRADE
36.6/ 100
METRIC RATING
185th/ 347
METRIC RANK
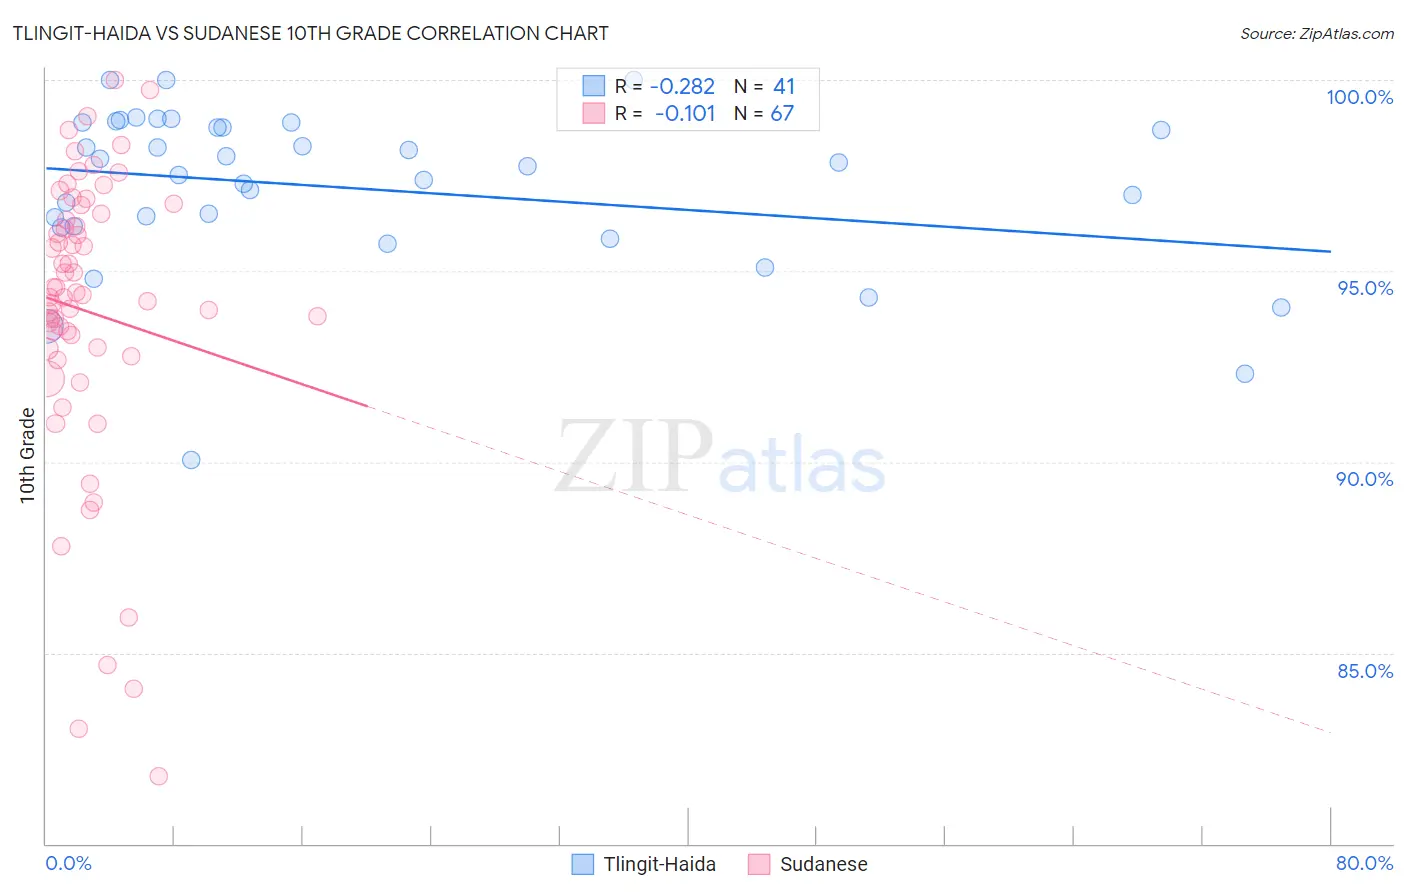
Tlingit-Haida vs Sudanese 10th Grade Correlation Chart
The statistical analysis conducted on geographies consisting of 60,871,919 people shows a weak negative correlation between the proportion of Tlingit-Haida and percentage of population with at least 10th grade education in the United States with a correlation coefficient (R) of -0.282 and weighted average of 95.7%. Similarly, the statistical analysis conducted on geographies consisting of 110,134,719 people shows a poor negative correlation between the proportion of Sudanese and percentage of population with at least 10th grade education in the United States with a correlation coefficient (R) of -0.101 and weighted average of 93.6%, a difference of 2.2%.
10th Grade Correlation Summary
| Measurement | Tlingit-Haida | Sudanese |
| Minimum | 90.1% | 81.8% |
| Maximum | 100.0% | 100.0% |
| Range | 9.9% | 18.2% |
| Mean | 97.2% | 93.9% |
| Median | 97.7% | 94.4% |
| Interquartile 25% (IQ1) | 96.2% | 93.0% |
| Interquartile 75% (IQ3) | 98.8% | 96.5% |
| Interquartile Range (IQR) | 2.7% | 3.5% |
| Standard Deviation (Sample) | 2.1% | 3.8% |
| Standard Deviation (Population) | 2.1% | 3.8% |
Similar Demographics by 10th Grade
Demographics Similar to Tlingit-Haida by 10th Grade
In terms of 10th grade, the demographic groups most similar to Tlingit-Haida are Danish (95.7%, a difference of 0.040%), English (95.6%, a difference of 0.040%), Tsimshian (95.6%, a difference of 0.040%), Irish (95.6%, a difference of 0.060%), and Croatian (95.7%, a difference of 0.080%).
| Demographics | Rating | Rank | 10th Grade |
| Carpatho Rusyns | 100.0 /100 | #5 | Exceptional 95.9% |
| Poles | 100.0 /100 | #6 | Exceptional 95.8% |
| Germans | 100.0 /100 | #7 | Exceptional 95.8% |
| Lithuanians | 100.0 /100 | #8 | Exceptional 95.8% |
| Finns | 100.0 /100 | #9 | Exceptional 95.8% |
| Croatians | 100.0 /100 | #10 | Exceptional 95.7% |
| Danes | 100.0 /100 | #11 | Exceptional 95.7% |
| Tlingit-Haida | 100.0 /100 | #12 | Exceptional 95.7% |
| English | 100.0 /100 | #13 | Exceptional 95.6% |
| Tsimshian | 100.0 /100 | #14 | Exceptional 95.6% |
| Irish | 100.0 /100 | #15 | Exceptional 95.6% |
| Scottish | 100.0 /100 | #16 | Exceptional 95.6% |
| Latvians | 100.0 /100 | #17 | Exceptional 95.6% |
| Italians | 100.0 /100 | #18 | Exceptional 95.6% |
| Scandinavians | 100.0 /100 | #19 | Exceptional 95.6% |
Demographics Similar to Sudanese by 10th Grade
In terms of 10th grade, the demographic groups most similar to Sudanese are Guamanian/Chamorro (93.6%, a difference of 0.0%), Choctaw (93.6%, a difference of 0.0%), Immigrants from Eastern Asia (93.6%, a difference of 0.010%), Colville (93.6%, a difference of 0.020%), and Liberian (93.6%, a difference of 0.020%).
| Demographics | Rating | Rank | 10th Grade |
| Sierra Leoneans | 46.1 /100 | #178 | Average 93.7% |
| Paraguayans | 45.3 /100 | #179 | Average 93.7% |
| Blackfeet | 42.8 /100 | #180 | Average 93.7% |
| Immigrants | Northern Africa | 41.6 /100 | #181 | Average 93.7% |
| Colville | 38.8 /100 | #182 | Fair 93.6% |
| Guamanians/Chamorros | 37.1 /100 | #183 | Fair 93.6% |
| Choctaw | 36.6 /100 | #184 | Fair 93.6% |
| Sudanese | 36.6 /100 | #185 | Fair 93.6% |
| Immigrants | Eastern Asia | 35.1 /100 | #186 | Fair 93.6% |
| Liberians | 34.7 /100 | #187 | Fair 93.6% |
| Marshallese | 33.2 /100 | #188 | Fair 93.6% |
| Immigrants | Pakistan | 32.5 /100 | #189 | Fair 93.6% |
| Laotians | 32.1 /100 | #190 | Fair 93.6% |
| Yup'ik | 31.1 /100 | #191 | Fair 93.6% |
| Immigrants | Malaysia | 28.0 /100 | #192 | Fair 93.5% |