Korean vs Sudanese 10th Grade
COMPARE
Korean
Sudanese
10th Grade
10th Grade Comparison
Koreans
Sudanese
93.2%
10TH GRADE
6.1/ 100
METRIC RATING
226th/ 347
METRIC RANK
93.6%
10TH GRADE
36.6/ 100
METRIC RATING
185th/ 347
METRIC RANK
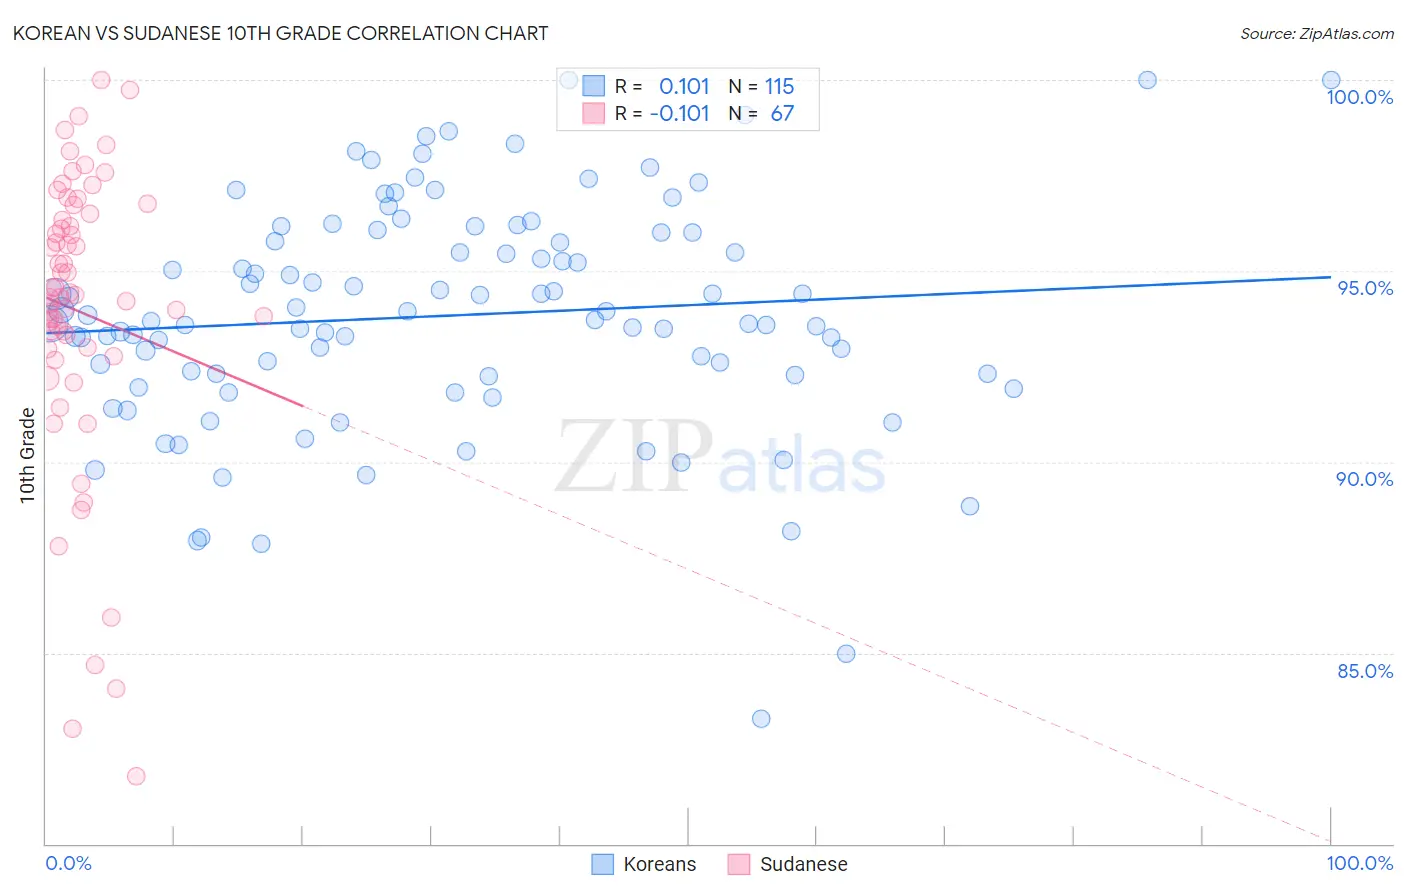
Korean vs Sudanese 10th Grade Correlation Chart
The statistical analysis conducted on geographies consisting of 510,943,943 people shows a poor positive correlation between the proportion of Koreans and percentage of population with at least 10th grade education in the United States with a correlation coefficient (R) of 0.101 and weighted average of 93.2%. Similarly, the statistical analysis conducted on geographies consisting of 110,134,719 people shows a poor negative correlation between the proportion of Sudanese and percentage of population with at least 10th grade education in the United States with a correlation coefficient (R) of -0.101 and weighted average of 93.6%, a difference of 0.49%.
10th Grade Correlation Summary
| Measurement | Korean | Sudanese |
| Minimum | 83.3% | 81.8% |
| Maximum | 100.0% | 100.0% |
| Range | 16.7% | 18.2% |
| Mean | 93.8% | 93.9% |
| Median | 93.7% | 94.4% |
| Interquartile 25% (IQ1) | 92.3% | 93.0% |
| Interquartile 75% (IQ3) | 96.0% | 96.5% |
| Interquartile Range (IQR) | 3.7% | 3.5% |
| Standard Deviation (Sample) | 3.0% | 3.8% |
| Standard Deviation (Population) | 3.0% | 3.8% |
Similar Demographics by 10th Grade
Demographics Similar to Koreans by 10th Grade
In terms of 10th grade, the demographic groups most similar to Koreans are Somali (93.2%, a difference of 0.0%), Black/African American (93.2%, a difference of 0.0%), Immigrants from China (93.2%, a difference of 0.010%), Bolivian (93.2%, a difference of 0.020%), and Immigrants from Ethiopia (93.1%, a difference of 0.040%).
| Demographics | Rating | Rank | 10th Grade |
| Seminole | 10.2 /100 | #219 | Poor 93.3% |
| Tongans | 9.5 /100 | #220 | Tragic 93.3% |
| Immigrants | Southern Europe | 8.9 /100 | #221 | Tragic 93.2% |
| Ethiopians | 7.9 /100 | #222 | Tragic 93.2% |
| Immigrants | Sierra Leone | 7.6 /100 | #223 | Tragic 93.2% |
| Bolivians | 6.7 /100 | #224 | Tragic 93.2% |
| Somalis | 6.2 /100 | #225 | Tragic 93.2% |
| Koreans | 6.1 /100 | #226 | Tragic 93.2% |
| Blacks/African Americans | 6.0 /100 | #227 | Tragic 93.2% |
| Immigrants | China | 5.9 /100 | #228 | Tragic 93.2% |
| Immigrants | Ethiopia | 5.1 /100 | #229 | Tragic 93.1% |
| Immigrants | Africa | 5.0 /100 | #230 | Tragic 93.1% |
| South American Indians | 4.9 /100 | #231 | Tragic 93.1% |
| Bahamians | 4.9 /100 | #232 | Tragic 93.1% |
| Comanche | 4.9 /100 | #233 | Tragic 93.1% |
Demographics Similar to Sudanese by 10th Grade
In terms of 10th grade, the demographic groups most similar to Sudanese are Guamanian/Chamorro (93.6%, a difference of 0.0%), Choctaw (93.6%, a difference of 0.0%), Immigrants from Eastern Asia (93.6%, a difference of 0.010%), Colville (93.6%, a difference of 0.020%), and Liberian (93.6%, a difference of 0.020%).
| Demographics | Rating | Rank | 10th Grade |
| Sierra Leoneans | 46.1 /100 | #178 | Average 93.7% |
| Paraguayans | 45.3 /100 | #179 | Average 93.7% |
| Blackfeet | 42.8 /100 | #180 | Average 93.7% |
| Immigrants | Northern Africa | 41.6 /100 | #181 | Average 93.7% |
| Colville | 38.8 /100 | #182 | Fair 93.6% |
| Guamanians/Chamorros | 37.1 /100 | #183 | Fair 93.6% |
| Choctaw | 36.6 /100 | #184 | Fair 93.6% |
| Sudanese | 36.6 /100 | #185 | Fair 93.6% |
| Immigrants | Eastern Asia | 35.1 /100 | #186 | Fair 93.6% |
| Liberians | 34.7 /100 | #187 | Fair 93.6% |
| Marshallese | 33.2 /100 | #188 | Fair 93.6% |
| Immigrants | Pakistan | 32.5 /100 | #189 | Fair 93.6% |
| Laotians | 32.1 /100 | #190 | Fair 93.6% |
| Yup'ik | 31.1 /100 | #191 | Fair 93.6% |
| Immigrants | Malaysia | 28.0 /100 | #192 | Fair 93.5% |