African vs Immigrants from Japan GED/Equivalency
COMPARE
African
Immigrants from Japan
GED/Equivalency
GED/Equivalency Comparison
Africans
Immigrants from Japan
83.4%
GED/EQUIVALENCY
0.5/ 100
METRIC RATING
256th/ 347
METRIC RANK
88.4%
GED/EQUIVALENCY
99.7/ 100
METRIC RATING
34th/ 347
METRIC RANK
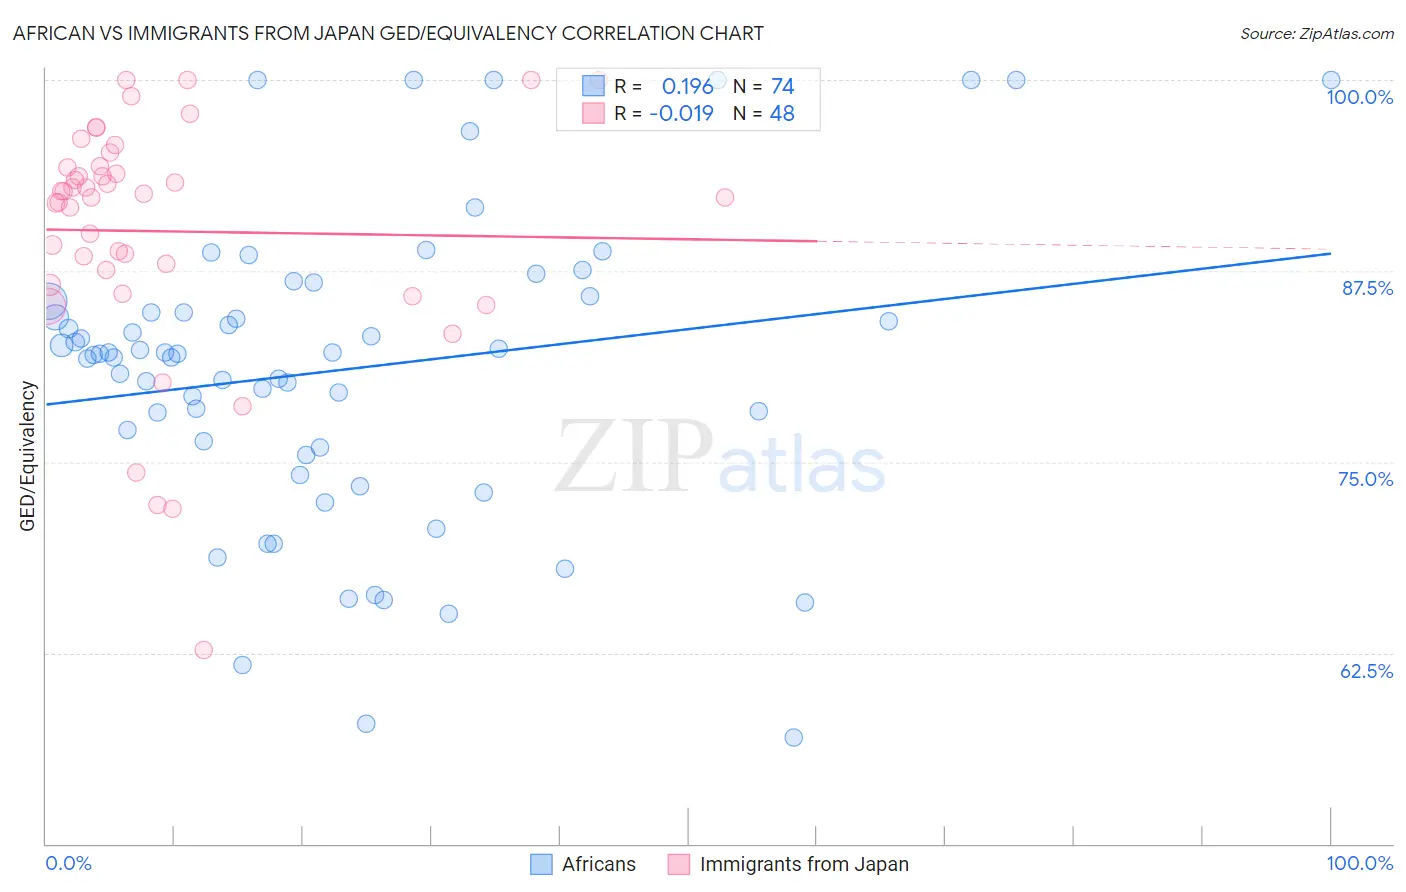
African vs Immigrants from Japan GED/Equivalency Correlation Chart
The statistical analysis conducted on geographies consisting of 470,092,963 people shows a poor positive correlation between the proportion of Africans and percentage of population with at least ged/equivalency education in the United States with a correlation coefficient (R) of 0.196 and weighted average of 83.4%. Similarly, the statistical analysis conducted on geographies consisting of 340,148,851 people shows no correlation between the proportion of Immigrants from Japan and percentage of population with at least ged/equivalency education in the United States with a correlation coefficient (R) of -0.019 and weighted average of 88.4%, a difference of 6.0%.
GED/Equivalency Correlation Summary
| Measurement | African | Immigrants from Japan |
| Minimum | 56.9% | 62.7% |
| Maximum | 100.0% | 100.0% |
| Range | 43.1% | 37.3% |
| Mean | 81.0% | 90.1% |
| Median | 82.1% | 92.4% |
| Interquartile 25% (IQ1) | 75.9% | 87.1% |
| Interquartile 75% (IQ3) | 85.5% | 94.3% |
| Interquartile Range (IQR) | 9.6% | 7.2% |
| Standard Deviation (Sample) | 9.9% | 7.9% |
| Standard Deviation (Population) | 9.8% | 7.8% |
Similar Demographics by GED/Equivalency
Demographics Similar to Africans by GED/Equivalency
In terms of ged/equivalency, the demographic groups most similar to Africans are Colville (83.4%, a difference of 0.010%), Jamaican (83.3%, a difference of 0.13%), Malaysian (83.3%, a difference of 0.16%), Creek (83.6%, a difference of 0.18%), and Comanche (83.6%, a difference of 0.20%).
| Demographics | Rating | Rank | GED/Equivalency |
| Crow | 1.1 /100 | #249 | Tragic 83.8% |
| Shoshone | 1.0 /100 | #250 | Tragic 83.7% |
| Spanish Americans | 0.8 /100 | #251 | Tragic 83.6% |
| Bahamians | 0.8 /100 | #252 | Tragic 83.6% |
| Comanche | 0.7 /100 | #253 | Tragic 83.6% |
| Creek | 0.7 /100 | #254 | Tragic 83.6% |
| Colville | 0.5 /100 | #255 | Tragic 83.4% |
| Africans | 0.5 /100 | #256 | Tragic 83.4% |
| Jamaicans | 0.4 /100 | #257 | Tragic 83.3% |
| Malaysians | 0.4 /100 | #258 | Tragic 83.3% |
| Immigrants | Vietnam | 0.3 /100 | #259 | Tragic 83.2% |
| Choctaw | 0.3 /100 | #260 | Tragic 83.1% |
| Inupiat | 0.2 /100 | #261 | Tragic 83.1% |
| Immigrants | Armenia | 0.2 /100 | #262 | Tragic 83.1% |
| Immigrants | Congo | 0.2 /100 | #263 | Tragic 83.1% |
Demographics Similar to Immigrants from Japan by GED/Equivalency
In terms of ged/equivalency, the demographic groups most similar to Immigrants from Japan are Immigrants from Sweden (88.4%, a difference of 0.010%), Immigrants from South Central Asia (88.4%, a difference of 0.020%), Immigrants from Belgium (88.3%, a difference of 0.040%), Danish (88.4%, a difference of 0.050%), and Bhutanese (88.4%, a difference of 0.070%).
| Demographics | Rating | Rank | GED/Equivalency |
| Immigrants | Lithuania | 99.8 /100 | #27 | Exceptional 88.6% |
| Immigrants | Northern Europe | 99.8 /100 | #28 | Exceptional 88.5% |
| Poles | 99.8 /100 | #29 | Exceptional 88.5% |
| Turks | 99.8 /100 | #30 | Exceptional 88.5% |
| Bhutanese | 99.8 /100 | #31 | Exceptional 88.4% |
| Danes | 99.8 /100 | #32 | Exceptional 88.4% |
| Immigrants | Sweden | 99.7 /100 | #33 | Exceptional 88.4% |
| Immigrants | Japan | 99.7 /100 | #34 | Exceptional 88.4% |
| Immigrants | South Central Asia | 99.7 /100 | #35 | Exceptional 88.4% |
| Immigrants | Belgium | 99.7 /100 | #36 | Exceptional 88.3% |
| Immigrants | Austria | 99.7 /100 | #37 | Exceptional 88.3% |
| Burmese | 99.7 /100 | #38 | Exceptional 88.3% |
| Immigrants | Israel | 99.6 /100 | #39 | Exceptional 88.2% |
| Italians | 99.6 /100 | #40 | Exceptional 88.2% |
| Finns | 99.6 /100 | #41 | Exceptional 88.2% |