Cambodian vs Welsh 6th Grade
COMPARE
Cambodian
Welsh
6th Grade
6th Grade Comparison
Cambodians
Welsh
97.3%
6TH GRADE
91.8/ 100
METRIC RATING
130th/ 347
METRIC RANK
98.5%
6TH GRADE
100.0/ 100
METRIC RATING
3rd/ 347
METRIC RANK
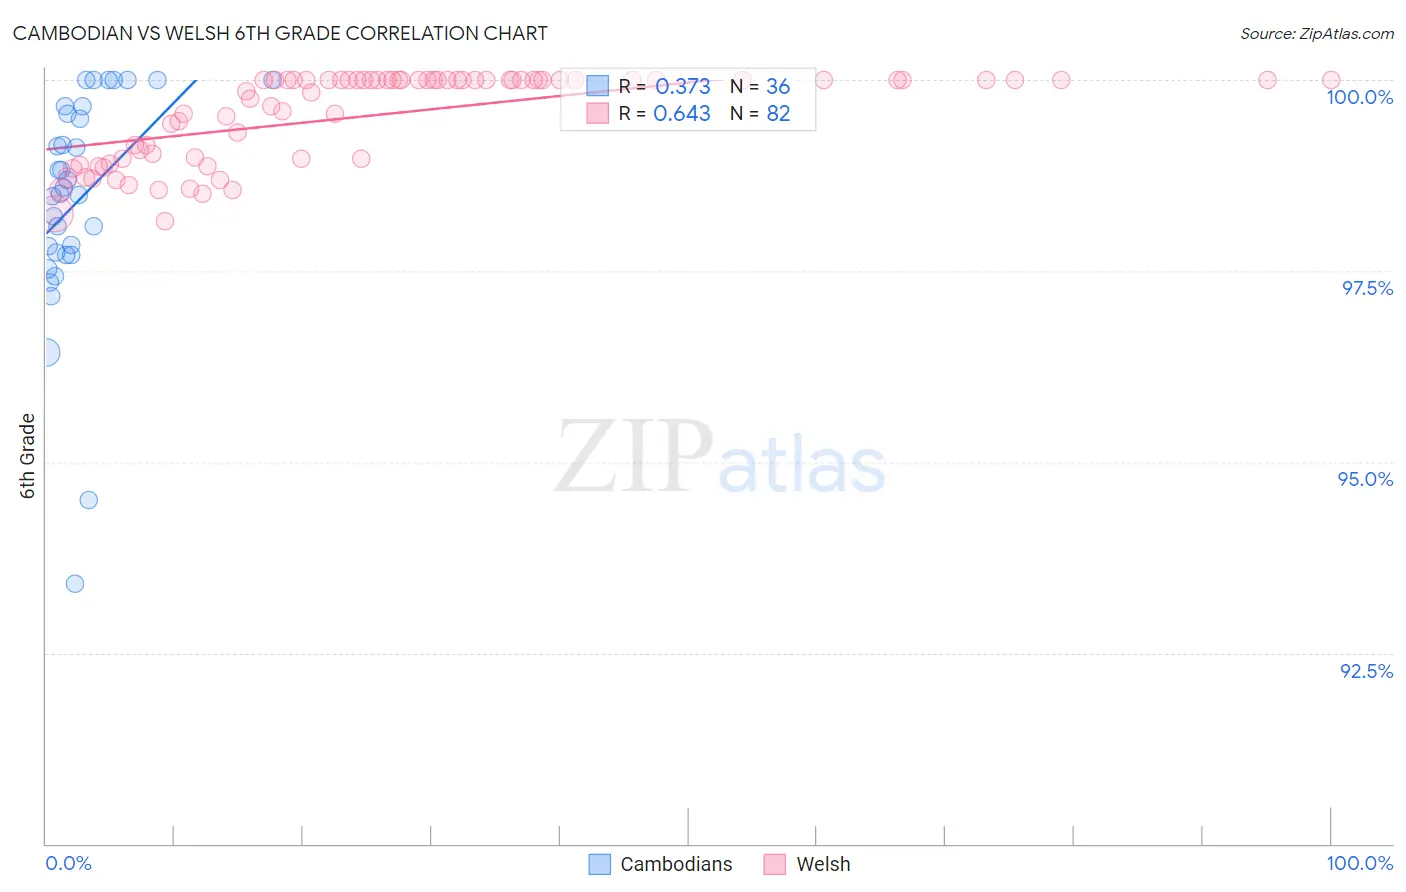
Cambodian vs Welsh 6th Grade Correlation Chart
The statistical analysis conducted on geographies consisting of 102,511,743 people shows a mild positive correlation between the proportion of Cambodians and percentage of population with at least 6th grade education in the United States with a correlation coefficient (R) of 0.373 and weighted average of 97.3%. Similarly, the statistical analysis conducted on geographies consisting of 239,959,962 people shows a significant positive correlation between the proportion of Welsh and percentage of population with at least 6th grade education in the United States with a correlation coefficient (R) of 0.643 and weighted average of 98.5%, a difference of 1.2%.
6th Grade Correlation Summary
| Measurement | Cambodian | Welsh |
| Minimum | 93.4% | 98.1% |
| Maximum | 100.0% | 100.0% |
| Range | 6.6% | 1.9% |
| Mean | 98.4% | 99.5% |
| Median | 98.5% | 100.0% |
| Interquartile 25% (IQ1) | 97.7% | 99.0% |
| Interquartile 75% (IQ3) | 99.6% | 100.0% |
| Interquartile Range (IQR) | 1.9% | 1.0% |
| Standard Deviation (Sample) | 1.5% | 0.58% |
| Standard Deviation (Population) | 1.5% | 0.58% |
Similar Demographics by 6th Grade
Demographics Similar to Cambodians by 6th Grade
In terms of 6th grade, the demographic groups most similar to Cambodians are Immigrants from Romania (97.3%, a difference of 0.0%), Immigrants from Serbia (97.3%, a difference of 0.0%), Immigrants from Europe (97.3%, a difference of 0.010%), Palestinian (97.3%, a difference of 0.010%), and Immigrants from Croatia (97.3%, a difference of 0.020%).
| Demographics | Rating | Rank | 6th Grade |
| Hmong | 94.4 /100 | #123 | Exceptional 97.4% |
| Okinawans | 94.2 /100 | #124 | Exceptional 97.4% |
| Spanish | 93.7 /100 | #125 | Exceptional 97.3% |
| Immigrants | Bulgaria | 93.6 /100 | #126 | Exceptional 97.3% |
| Immigrants | Croatia | 93.1 /100 | #127 | Exceptional 97.3% |
| Immigrants | Romania | 92.0 /100 | #128 | Exceptional 97.3% |
| Immigrants | Serbia | 91.9 /100 | #129 | Exceptional 97.3% |
| Cambodians | 91.8 /100 | #130 | Exceptional 97.3% |
| Immigrants | Europe | 91.1 /100 | #131 | Exceptional 97.3% |
| Palestinians | 90.9 /100 | #132 | Exceptional 97.3% |
| Immigrants | Moldova | 90.0 /100 | #133 | Excellent 97.3% |
| Immigrants | Kuwait | 89.5 /100 | #134 | Excellent 97.3% |
| Immigrants | Hungary | 89.5 /100 | #135 | Excellent 97.3% |
| Filipinos | 88.9 /100 | #136 | Excellent 97.3% |
| Burmese | 87.8 /100 | #137 | Excellent 97.3% |
Demographics Similar to Welsh by 6th Grade
In terms of 6th grade, the demographic groups most similar to Welsh are Ottawa (98.5%, a difference of 0.010%), Dutch (98.4%, a difference of 0.13%), Tsimshian (98.3%, a difference of 0.20%), Norwegian (98.3%, a difference of 0.21%), and German (98.2%, a difference of 0.24%).
| Demographics | Rating | Rank | 6th Grade |
| Crow | 100.0 /100 | #1 | Exceptional 99.4% |
| Ottawa | 100.0 /100 | #2 | Exceptional 98.5% |
| Welsh | 100.0 /100 | #3 | Exceptional 98.5% |
| Dutch | 100.0 /100 | #4 | Exceptional 98.4% |
| Tsimshian | 100.0 /100 | #5 | Exceptional 98.3% |
| Norwegians | 100.0 /100 | #6 | Exceptional 98.3% |
| Germans | 100.0 /100 | #7 | Exceptional 98.2% |
| Slovaks | 100.0 /100 | #8 | Exceptional 98.2% |
| Slovenes | 100.0 /100 | #9 | Exceptional 98.2% |
| Swedes | 100.0 /100 | #10 | Exceptional 98.2% |
| English | 100.0 /100 | #11 | Exceptional 98.1% |
| Alaskan Athabascans | 100.0 /100 | #12 | Exceptional 98.1% |
| Tlingit-Haida | 100.0 /100 | #13 | Exceptional 98.1% |
| Carpatho Rusyns | 100.0 /100 | #14 | Exceptional 98.1% |
| Inupiat | 100.0 /100 | #15 | Exceptional 98.1% |