Immigrants vs Immigrants from Uruguay 6th Grade
COMPARE
Immigrants
Immigrants from Uruguay
6th Grade
6th Grade Comparison
Immigrants
Immigrants from Uruguay
95.7%
6TH GRADE
0.0/ 100
METRIC RATING
301st/ 347
METRIC RANK
96.5%
6TH GRADE
0.6/ 100
METRIC RATING
252nd/ 347
METRIC RANK
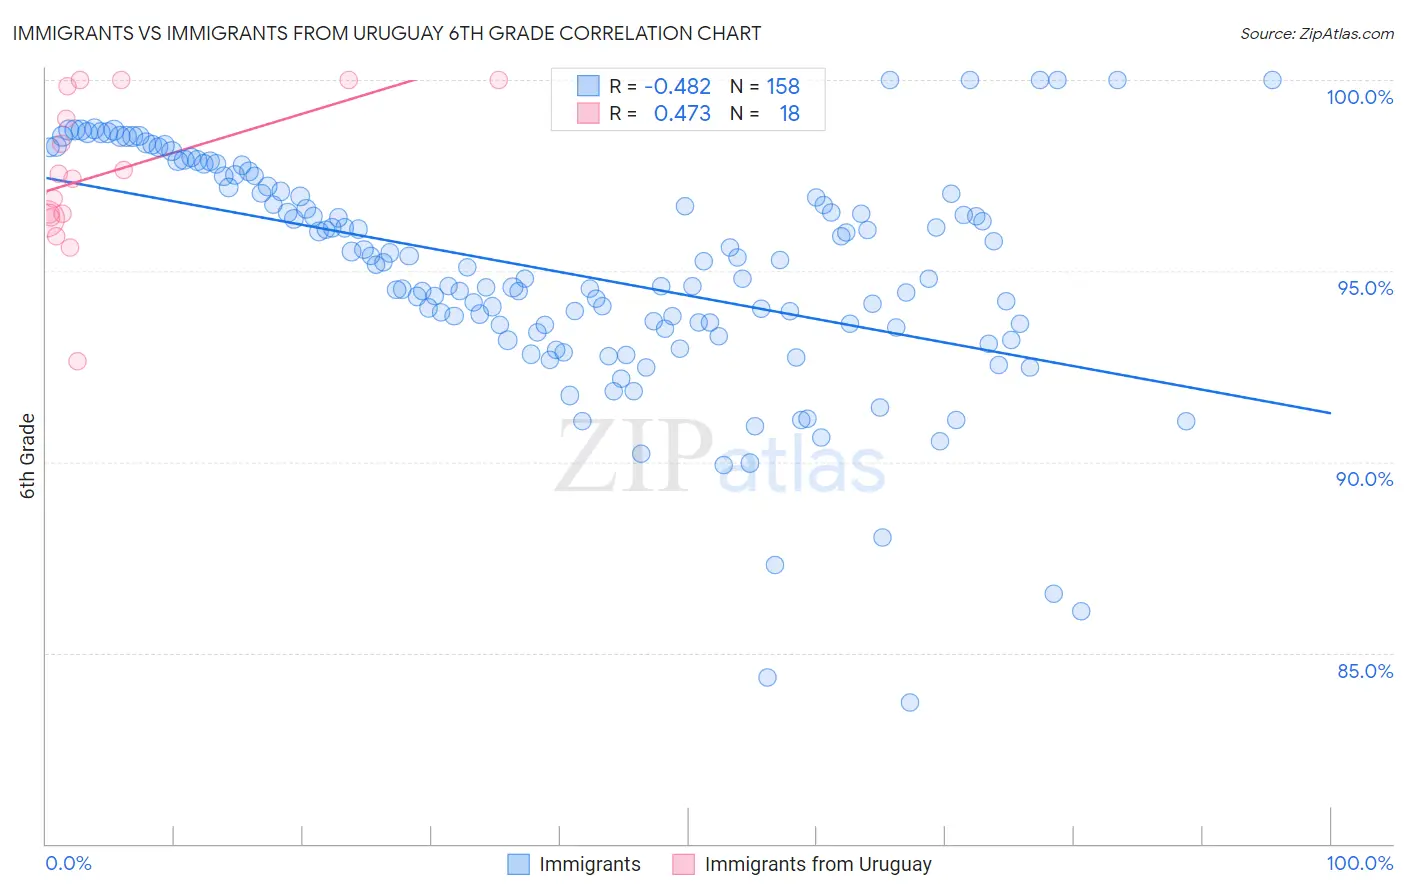
Immigrants vs Immigrants from Uruguay 6th Grade Correlation Chart
The statistical analysis conducted on geographies consisting of 577,786,840 people shows a moderate negative correlation between the proportion of Immigrants and percentage of population with at least 6th grade education in the United States with a correlation coefficient (R) of -0.482 and weighted average of 95.7%. Similarly, the statistical analysis conducted on geographies consisting of 133,259,667 people shows a moderate positive correlation between the proportion of Immigrants from Uruguay and percentage of population with at least 6th grade education in the United States with a correlation coefficient (R) of 0.473 and weighted average of 96.5%, a difference of 0.79%.
6th Grade Correlation Summary
| Measurement | Immigrants | Immigrants from Uruguay |
| Minimum | 83.7% | 92.6% |
| Maximum | 100.0% | 100.0% |
| Range | 16.3% | 7.4% |
| Mean | 95.0% | 97.6% |
| Median | 95.1% | 97.5% |
| Interquartile 25% (IQ1) | 93.5% | 96.4% |
| Interquartile 75% (IQ3) | 97.2% | 99.8% |
| Interquartile Range (IQR) | 3.7% | 3.4% |
| Standard Deviation (Sample) | 3.0% | 2.0% |
| Standard Deviation (Population) | 3.0% | 1.9% |
Similar Demographics by 6th Grade
Demographics Similar to Immigrants by 6th Grade
In terms of 6th grade, the demographic groups most similar to Immigrants are Immigrants from Dominica (95.7%, a difference of 0.010%), Immigrants from Laos (95.7%, a difference of 0.020%), Immigrants from Burma/Myanmar (95.7%, a difference of 0.020%), Sri Lankan (95.8%, a difference of 0.030%), and Bangladeshi (95.7%, a difference of 0.080%).
| Demographics | Rating | Rank | 6th Grade |
| British West Indians | 0.0 /100 | #294 | Tragic 96.0% |
| Immigrants | Grenada | 0.0 /100 | #295 | Tragic 95.9% |
| Immigrants | South Eastern Asia | 0.0 /100 | #296 | Tragic 95.9% |
| Haitians | 0.0 /100 | #297 | Tragic 95.8% |
| Sri Lankans | 0.0 /100 | #298 | Tragic 95.8% |
| Immigrants | Laos | 0.0 /100 | #299 | Tragic 95.7% |
| Immigrants | Dominica | 0.0 /100 | #300 | Tragic 95.7% |
| Immigrants | Immigrants | 0.0 /100 | #301 | Tragic 95.7% |
| Immigrants | Burma/Myanmar | 0.0 /100 | #302 | Tragic 95.7% |
| Bangladeshis | 0.0 /100 | #303 | Tragic 95.7% |
| Indonesians | 0.0 /100 | #304 | Tragic 95.6% |
| Immigrants | Cuba | 0.0 /100 | #305 | Tragic 95.6% |
| Immigrants | Haiti | 0.0 /100 | #306 | Tragic 95.6% |
| Guyanese | 0.0 /100 | #307 | Tragic 95.6% |
| Immigrants | Caribbean | 0.0 /100 | #308 | Tragic 95.6% |
Demographics Similar to Immigrants from Uruguay by 6th Grade
In terms of 6th grade, the demographic groups most similar to Immigrants from Uruguay are Immigrants from Senegal (96.5%, a difference of 0.010%), Jamaican (96.5%, a difference of 0.010%), Immigrants from Ethiopia (96.5%, a difference of 0.010%), Immigrants from Congo (96.5%, a difference of 0.010%), and Immigrants from Middle Africa (96.5%, a difference of 0.020%).
| Demographics | Rating | Rank | 6th Grade |
| Immigrants | Costa Rica | 1.3 /100 | #245 | Tragic 96.6% |
| Immigrants | Africa | 1.3 /100 | #246 | Tragic 96.6% |
| Bolivians | 1.0 /100 | #247 | Tragic 96.5% |
| Tohono O'odham | 1.0 /100 | #248 | Tragic 96.5% |
| Colombians | 0.9 /100 | #249 | Tragic 96.5% |
| Immigrants | Middle Africa | 0.8 /100 | #250 | Tragic 96.5% |
| Immigrants | Senegal | 0.7 /100 | #251 | Tragic 96.5% |
| Immigrants | Uruguay | 0.6 /100 | #252 | Tragic 96.5% |
| Jamaicans | 0.6 /100 | #253 | Tragic 96.5% |
| Immigrants | Ethiopia | 0.6 /100 | #254 | Tragic 96.5% |
| Immigrants | Congo | 0.6 /100 | #255 | Tragic 96.5% |
| U.S. Virgin Islanders | 0.5 /100 | #256 | Tragic 96.5% |
| Taiwanese | 0.5 /100 | #257 | Tragic 96.5% |
| Immigrants | China | 0.4 /100 | #258 | Tragic 96.4% |
| South Americans | 0.4 /100 | #259 | Tragic 96.4% |