Cambodian vs Immigrants from Bangladesh 6th Grade
COMPARE
Cambodian
Immigrants from Bangladesh
6th Grade
6th Grade Comparison
Cambodians
Immigrants from Bangladesh
97.3%
6TH GRADE
91.8/ 100
METRIC RATING
130th/ 347
METRIC RANK
95.4%
6TH GRADE
0.0/ 100
METRIC RATING
315th/ 347
METRIC RANK
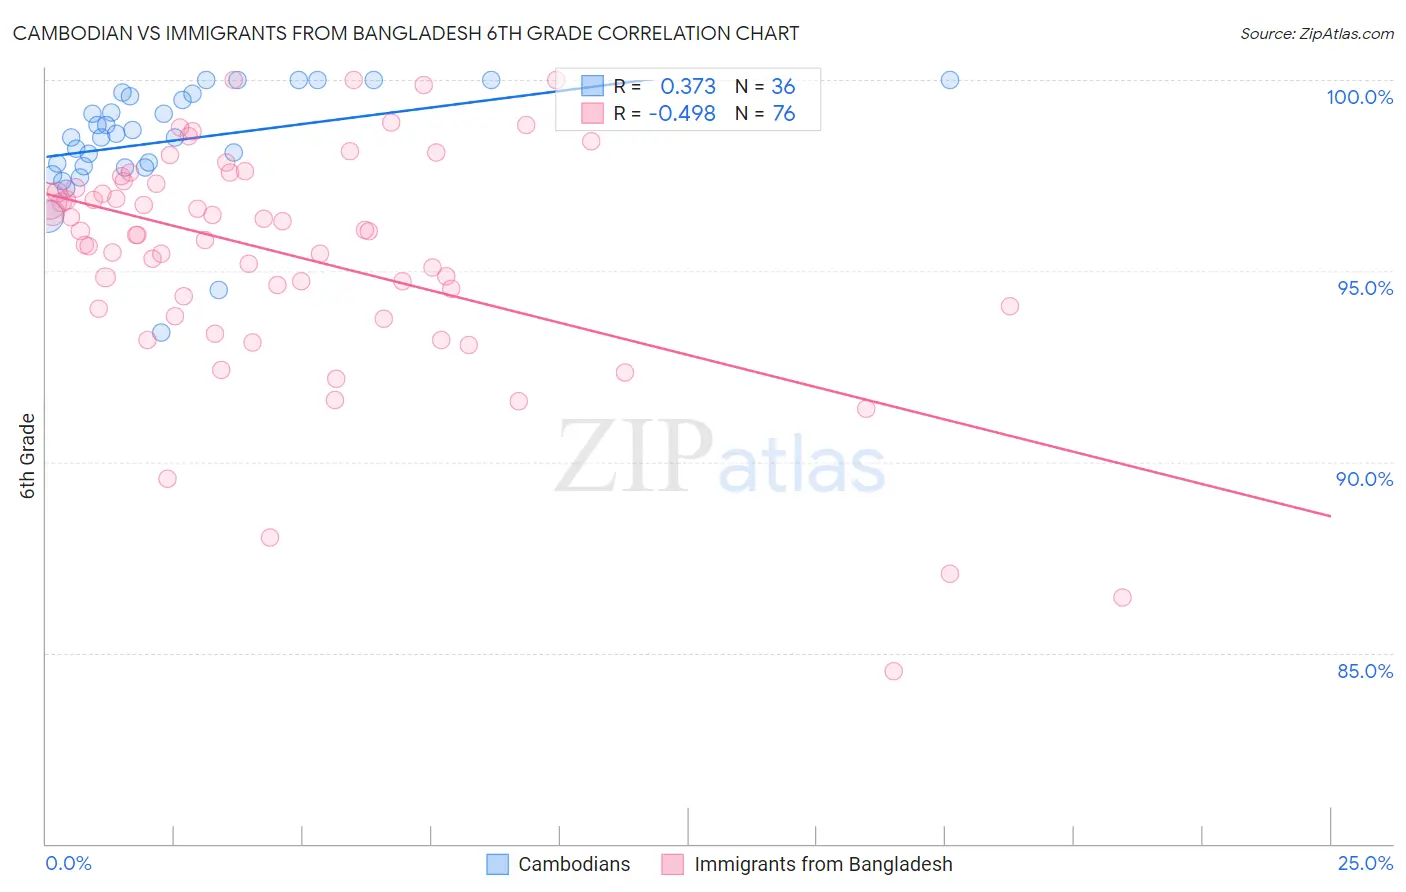
Cambodian vs Immigrants from Bangladesh 6th Grade Correlation Chart
The statistical analysis conducted on geographies consisting of 102,511,743 people shows a mild positive correlation between the proportion of Cambodians and percentage of population with at least 6th grade education in the United States with a correlation coefficient (R) of 0.373 and weighted average of 97.3%. Similarly, the statistical analysis conducted on geographies consisting of 203,672,706 people shows a moderate negative correlation between the proportion of Immigrants from Bangladesh and percentage of population with at least 6th grade education in the United States with a correlation coefficient (R) of -0.498 and weighted average of 95.4%, a difference of 2.0%.
6th Grade Correlation Summary
| Measurement | Cambodian | Immigrants from Bangladesh |
| Minimum | 93.4% | 84.5% |
| Maximum | 100.0% | 100.0% |
| Range | 6.6% | 15.5% |
| Mean | 98.4% | 95.4% |
| Median | 98.5% | 96.0% |
| Interquartile 25% (IQ1) | 97.7% | 94.0% |
| Interquartile 75% (IQ3) | 99.6% | 97.3% |
| Interquartile Range (IQR) | 1.9% | 3.3% |
| Standard Deviation (Sample) | 1.5% | 3.1% |
| Standard Deviation (Population) | 1.5% | 3.0% |
Similar Demographics by 6th Grade
Demographics Similar to Cambodians by 6th Grade
In terms of 6th grade, the demographic groups most similar to Cambodians are Immigrants from Romania (97.3%, a difference of 0.0%), Immigrants from Serbia (97.3%, a difference of 0.0%), Immigrants from Europe (97.3%, a difference of 0.010%), Palestinian (97.3%, a difference of 0.010%), and Immigrants from Croatia (97.3%, a difference of 0.020%).
| Demographics | Rating | Rank | 6th Grade |
| Hmong | 94.4 /100 | #123 | Exceptional 97.4% |
| Okinawans | 94.2 /100 | #124 | Exceptional 97.4% |
| Spanish | 93.7 /100 | #125 | Exceptional 97.3% |
| Immigrants | Bulgaria | 93.6 /100 | #126 | Exceptional 97.3% |
| Immigrants | Croatia | 93.1 /100 | #127 | Exceptional 97.3% |
| Immigrants | Romania | 92.0 /100 | #128 | Exceptional 97.3% |
| Immigrants | Serbia | 91.9 /100 | #129 | Exceptional 97.3% |
| Cambodians | 91.8 /100 | #130 | Exceptional 97.3% |
| Immigrants | Europe | 91.1 /100 | #131 | Exceptional 97.3% |
| Palestinians | 90.9 /100 | #132 | Exceptional 97.3% |
| Immigrants | Moldova | 90.0 /100 | #133 | Excellent 97.3% |
| Immigrants | Kuwait | 89.5 /100 | #134 | Excellent 97.3% |
| Immigrants | Hungary | 89.5 /100 | #135 | Excellent 97.3% |
| Filipinos | 88.9 /100 | #136 | Excellent 97.3% |
| Burmese | 87.8 /100 | #137 | Excellent 97.3% |
Demographics Similar to Immigrants from Bangladesh by 6th Grade
In terms of 6th grade, the demographic groups most similar to Immigrants from Bangladesh are Immigrants from Vietnam (95.4%, a difference of 0.010%), Japanese (95.4%, a difference of 0.010%), Nicaraguan (95.4%, a difference of 0.020%), Vietnamese (95.3%, a difference of 0.040%), and Belizean (95.3%, a difference of 0.070%).
| Demographics | Rating | Rank | 6th Grade |
| Immigrants | Caribbean | 0.0 /100 | #308 | Tragic 95.6% |
| Puerto Ricans | 0.0 /100 | #309 | Tragic 95.5% |
| Ecuadorians | 0.0 /100 | #310 | Tragic 95.5% |
| Immigrants | Portugal | 0.0 /100 | #311 | Tragic 95.5% |
| Immigrants | Guyana | 0.0 /100 | #312 | Tragic 95.5% |
| Nicaraguans | 0.0 /100 | #313 | Tragic 95.4% |
| Immigrants | Vietnam | 0.0 /100 | #314 | Tragic 95.4% |
| Immigrants | Bangladesh | 0.0 /100 | #315 | Tragic 95.4% |
| Japanese | 0.0 /100 | #316 | Tragic 95.4% |
| Vietnamese | 0.0 /100 | #317 | Tragic 95.3% |
| Belizeans | 0.0 /100 | #318 | Tragic 95.3% |
| Immigrants | Belize | 0.0 /100 | #319 | Tragic 95.3% |
| Immigrants | Ecuador | 0.0 /100 | #320 | Tragic 95.3% |
| Immigrants | Fiji | 0.0 /100 | #321 | Tragic 95.2% |
| Immigrants | Cambodia | 0.0 /100 | #322 | Tragic 95.2% |