Paraguayan vs Immigrants from Uruguay 6th Grade
COMPARE
Paraguayan
Immigrants from Uruguay
6th Grade
6th Grade Comparison
Paraguayans
Immigrants from Uruguay
96.9%
6TH GRADE
26.6/ 100
METRIC RATING
193rd/ 347
METRIC RANK
96.5%
6TH GRADE
0.6/ 100
METRIC RATING
252nd/ 347
METRIC RANK
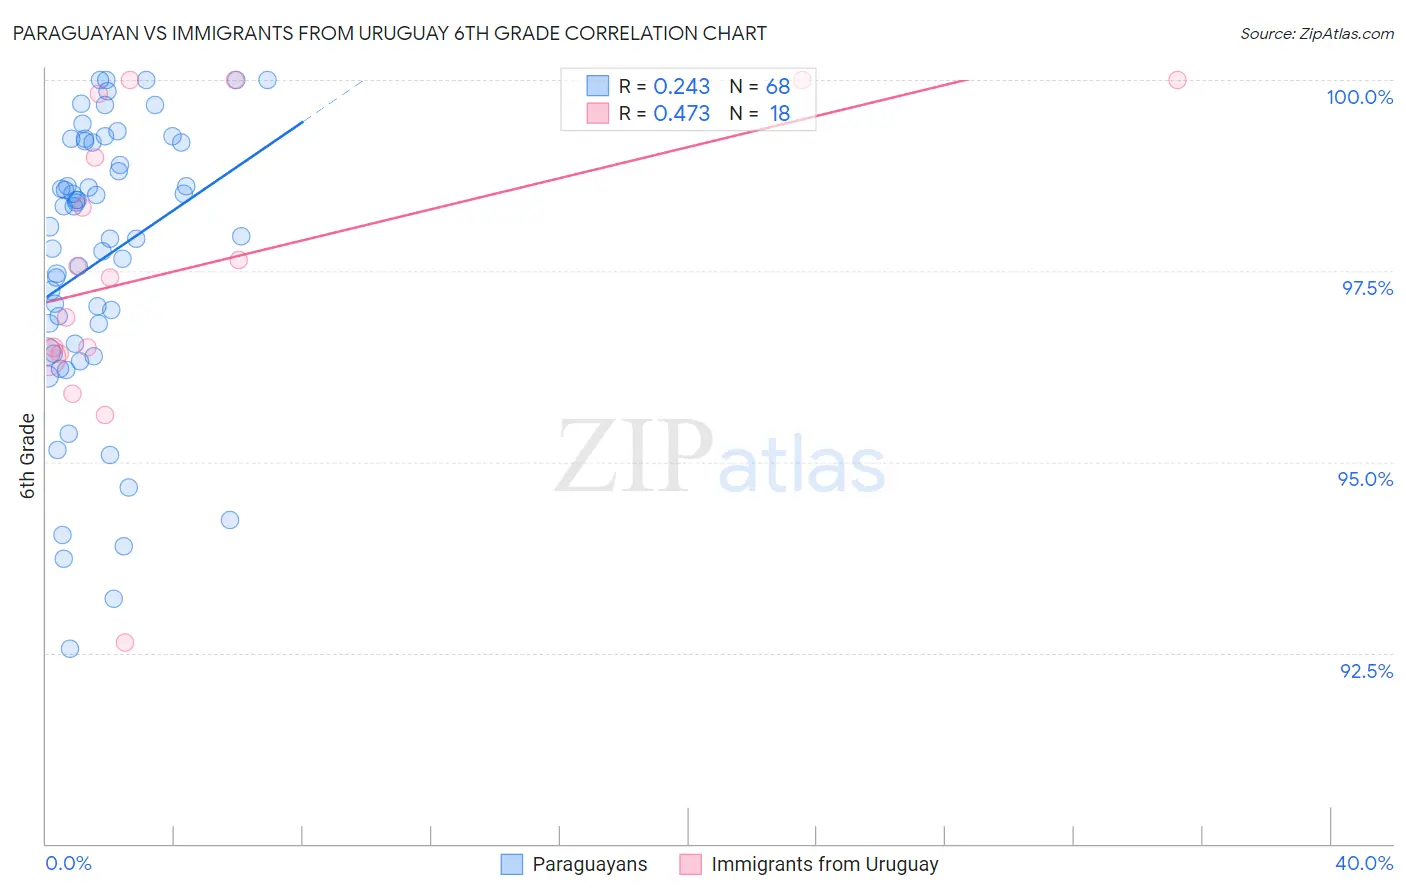
Paraguayan vs Immigrants from Uruguay 6th Grade Correlation Chart
The statistical analysis conducted on geographies consisting of 95,115,093 people shows a weak positive correlation between the proportion of Paraguayans and percentage of population with at least 6th grade education in the United States with a correlation coefficient (R) of 0.243 and weighted average of 96.9%. Similarly, the statistical analysis conducted on geographies consisting of 133,259,667 people shows a moderate positive correlation between the proportion of Immigrants from Uruguay and percentage of population with at least 6th grade education in the United States with a correlation coefficient (R) of 0.473 and weighted average of 96.5%, a difference of 0.46%.
6th Grade Correlation Summary
| Measurement | Paraguayan | Immigrants from Uruguay |
| Minimum | 92.6% | 92.6% |
| Maximum | 100.0% | 100.0% |
| Range | 7.4% | 7.4% |
| Mean | 97.6% | 97.6% |
| Median | 98.0% | 97.5% |
| Interquartile 25% (IQ1) | 96.5% | 96.4% |
| Interquartile 75% (IQ3) | 99.2% | 99.8% |
| Interquartile Range (IQR) | 2.7% | 3.4% |
| Standard Deviation (Sample) | 1.8% | 2.0% |
| Standard Deviation (Population) | 1.8% | 1.9% |
Similar Demographics by 6th Grade
Demographics Similar to Paraguayans by 6th Grade
In terms of 6th grade, the demographic groups most similar to Paraguayans are Panamanian (96.9%, a difference of 0.0%), Hawaiian (96.9%, a difference of 0.0%), Dutch West Indian (96.9%, a difference of 0.010%), Immigrants from Lebanon (96.9%, a difference of 0.010%), and Immigrants from Brazil (96.9%, a difference of 0.010%).
| Demographics | Rating | Rank | 6th Grade |
| Immigrants | Egypt | 31.4 /100 | #186 | Fair 97.0% |
| Guamanians/Chamorros | 30.6 /100 | #187 | Fair 97.0% |
| Immigrants | Argentina | 30.4 /100 | #188 | Fair 97.0% |
| Blacks/African Americans | 30.2 /100 | #189 | Fair 97.0% |
| Dutch West Indians | 28.3 /100 | #190 | Fair 96.9% |
| Panamanians | 27.3 /100 | #191 | Fair 96.9% |
| Hawaiians | 27.0 /100 | #192 | Fair 96.9% |
| Paraguayans | 26.6 /100 | #193 | Fair 96.9% |
| Immigrants | Lebanon | 25.6 /100 | #194 | Fair 96.9% |
| Immigrants | Brazil | 25.5 /100 | #195 | Fair 96.9% |
| Immigrants | Uganda | 21.2 /100 | #196 | Fair 96.9% |
| Brazilians | 20.1 /100 | #197 | Fair 96.9% |
| Immigrants | Albania | 18.8 /100 | #198 | Poor 96.9% |
| Immigrants | Northern Africa | 15.7 /100 | #199 | Poor 96.9% |
| Africans | 14.8 /100 | #200 | Poor 96.9% |
Demographics Similar to Immigrants from Uruguay by 6th Grade
In terms of 6th grade, the demographic groups most similar to Immigrants from Uruguay are Immigrants from Senegal (96.5%, a difference of 0.010%), Jamaican (96.5%, a difference of 0.010%), Immigrants from Ethiopia (96.5%, a difference of 0.010%), Immigrants from Congo (96.5%, a difference of 0.010%), and Immigrants from Middle Africa (96.5%, a difference of 0.020%).
| Demographics | Rating | Rank | 6th Grade |
| Immigrants | Costa Rica | 1.3 /100 | #245 | Tragic 96.6% |
| Immigrants | Africa | 1.3 /100 | #246 | Tragic 96.6% |
| Bolivians | 1.0 /100 | #247 | Tragic 96.5% |
| Tohono O'odham | 1.0 /100 | #248 | Tragic 96.5% |
| Colombians | 0.9 /100 | #249 | Tragic 96.5% |
| Immigrants | Middle Africa | 0.8 /100 | #250 | Tragic 96.5% |
| Immigrants | Senegal | 0.7 /100 | #251 | Tragic 96.5% |
| Immigrants | Uruguay | 0.6 /100 | #252 | Tragic 96.5% |
| Jamaicans | 0.6 /100 | #253 | Tragic 96.5% |
| Immigrants | Ethiopia | 0.6 /100 | #254 | Tragic 96.5% |
| Immigrants | Congo | 0.6 /100 | #255 | Tragic 96.5% |
| U.S. Virgin Islanders | 0.5 /100 | #256 | Tragic 96.5% |
| Taiwanese | 0.5 /100 | #257 | Tragic 96.5% |
| Immigrants | China | 0.4 /100 | #258 | Tragic 96.4% |
| South Americans | 0.4 /100 | #259 | Tragic 96.4% |