Cajun vs Immigrants from Eastern Africa High School Diploma
COMPARE
Cajun
Immigrants from Eastern Africa
High School Diploma
High School Diploma Comparison
Cajuns
Immigrants from Eastern Africa
87.3%
HIGH SCHOOL DIPLOMA
0.4/ 100
METRIC RATING
260th/ 347
METRIC RANK
88.9%
HIGH SCHOOL DIPLOMA
35.8/ 100
METRIC RATING
186th/ 347
METRIC RANK
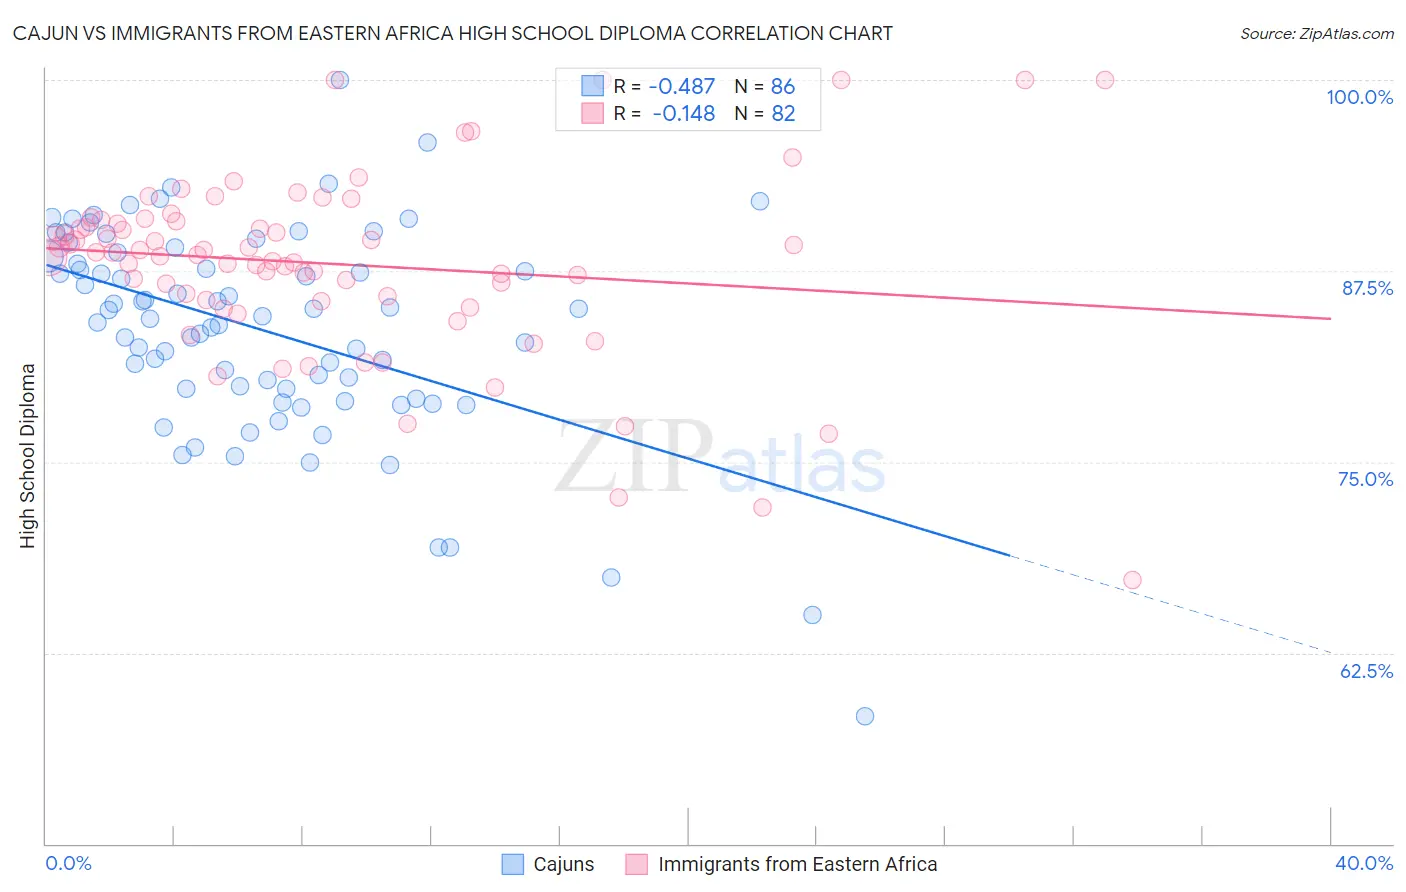
Cajun vs Immigrants from Eastern Africa High School Diploma Correlation Chart
The statistical analysis conducted on geographies consisting of 149,713,149 people shows a moderate negative correlation between the proportion of Cajuns and percentage of population with at least high school diploma education in the United States with a correlation coefficient (R) of -0.487 and weighted average of 87.3%. Similarly, the statistical analysis conducted on geographies consisting of 355,153,076 people shows a poor negative correlation between the proportion of Immigrants from Eastern Africa and percentage of population with at least high school diploma education in the United States with a correlation coefficient (R) of -0.148 and weighted average of 88.9%, a difference of 1.9%.
High School Diploma Correlation Summary
| Measurement | Cajun | Immigrants from Eastern Africa |
| Minimum | 58.4% | 67.3% |
| Maximum | 100.0% | 100.0% |
| Range | 41.6% | 32.7% |
| Mean | 83.6% | 88.0% |
| Median | 84.5% | 88.6% |
| Interquartile 25% (IQ1) | 79.8% | 85.6% |
| Interquartile 75% (IQ3) | 88.4% | 90.7% |
| Interquartile Range (IQR) | 8.7% | 5.2% |
| Standard Deviation (Sample) | 6.9% | 6.0% |
| Standard Deviation (Population) | 6.8% | 6.0% |
Similar Demographics by High School Diploma
Demographics Similar to Cajuns by High School Diploma
In terms of high school diploma, the demographic groups most similar to Cajuns are Seminole (87.3%, a difference of 0.020%), Immigrants from Peru (87.3%, a difference of 0.050%), Immigrants from Ghana (87.4%, a difference of 0.080%), Immigrants from Western Africa (87.4%, a difference of 0.080%), and Immigrants from South Eastern Asia (87.2%, a difference of 0.080%).
| Demographics | Rating | Rank | High School Diploma |
| Immigrants | Uruguay | 1.0 /100 | #253 | Tragic 87.6% |
| Immigrants | Colombia | 1.0 /100 | #254 | Tragic 87.6% |
| Immigrants | Senegal | 0.9 /100 | #255 | Tragic 87.6% |
| Africans | 0.7 /100 | #256 | Tragic 87.5% |
| Bahamians | 0.7 /100 | #257 | Tragic 87.5% |
| Immigrants | Ghana | 0.5 /100 | #258 | Tragic 87.4% |
| Immigrants | Western Africa | 0.5 /100 | #259 | Tragic 87.4% |
| Cajuns | 0.4 /100 | #260 | Tragic 87.3% |
| Seminole | 0.4 /100 | #261 | Tragic 87.3% |
| Immigrants | Peru | 0.4 /100 | #262 | Tragic 87.3% |
| Immigrants | South Eastern Asia | 0.3 /100 | #263 | Tragic 87.2% |
| Jamaicans | 0.3 /100 | #264 | Tragic 87.2% |
| U.S. Virgin Islanders | 0.2 /100 | #265 | Tragic 87.1% |
| Immigrants | Congo | 0.2 /100 | #266 | Tragic 87.0% |
| Blacks/African Americans | 0.2 /100 | #267 | Tragic 87.0% |
Demographics Similar to Immigrants from Eastern Africa by High School Diploma
In terms of high school diploma, the demographic groups most similar to Immigrants from Eastern Africa are Guamanian/Chamorro (88.9%, a difference of 0.0%), Ethiopian (89.0%, a difference of 0.020%), Immigrants from Sudan (88.9%, a difference of 0.040%), Immigrants from Uganda (88.9%, a difference of 0.050%), and Immigrants from Syria (89.0%, a difference of 0.060%).
| Demographics | Rating | Rank | High School Diploma |
| Americans | 47.2 /100 | #179 | Average 89.1% |
| Bolivians | 45.2 /100 | #180 | Average 89.1% |
| Venezuelans | 43.6 /100 | #181 | Average 89.1% |
| Spaniards | 43.4 /100 | #182 | Average 89.1% |
| Potawatomi | 42.5 /100 | #183 | Average 89.0% |
| Immigrants | Syria | 39.2 /100 | #184 | Fair 89.0% |
| Ethiopians | 37.0 /100 | #185 | Fair 89.0% |
| Immigrants | Eastern Africa | 35.8 /100 | #186 | Fair 88.9% |
| Guamanians/Chamorros | 35.5 /100 | #187 | Fair 88.9% |
| Immigrants | Sudan | 33.4 /100 | #188 | Fair 88.9% |
| Immigrants | Uganda | 32.6 /100 | #189 | Fair 88.9% |
| Immigrants | Chile | 31.9 /100 | #190 | Fair 88.9% |
| Immigrants | Ethiopia | 30.9 /100 | #191 | Fair 88.9% |
| Moroccans | 29.5 /100 | #192 | Fair 88.8% |
| Immigrants | Oceania | 26.9 /100 | #193 | Fair 88.8% |