Cajun vs Spanish High School Diploma
COMPARE
Cajun
Spanish
High School Diploma
High School Diploma Comparison
Cajuns
Spanish
87.3%
HIGH SCHOOL DIPLOMA
0.4/ 100
METRIC RATING
260th/ 347
METRIC RANK
89.2%
HIGH SCHOOL DIPLOMA
52.9/ 100
METRIC RATING
171st/ 347
METRIC RANK
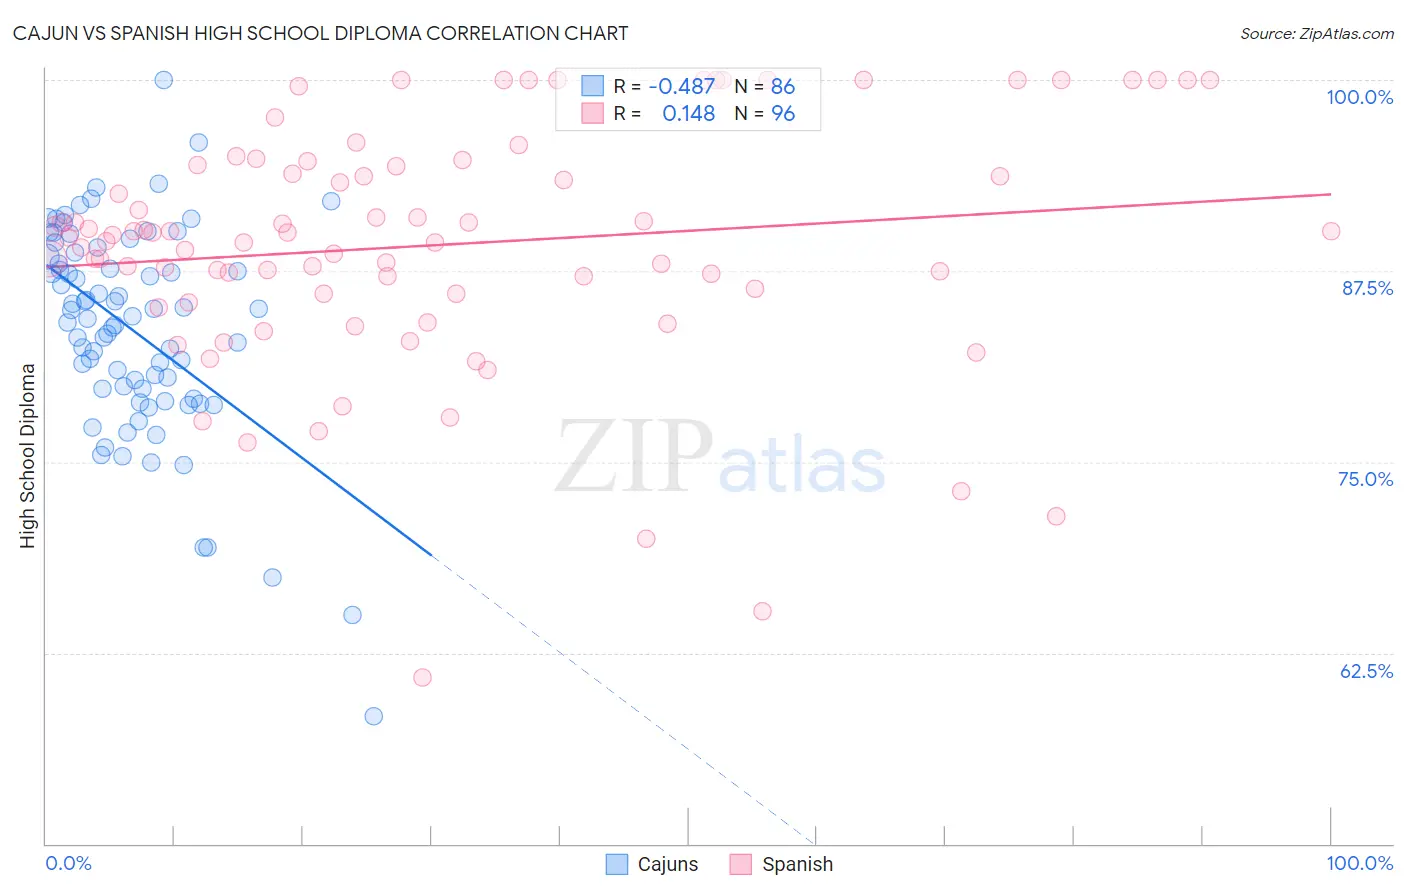
Cajun vs Spanish High School Diploma Correlation Chart
The statistical analysis conducted on geographies consisting of 149,713,149 people shows a moderate negative correlation between the proportion of Cajuns and percentage of population with at least high school diploma education in the United States with a correlation coefficient (R) of -0.487 and weighted average of 87.3%. Similarly, the statistical analysis conducted on geographies consisting of 422,189,152 people shows a poor positive correlation between the proportion of Spanish and percentage of population with at least high school diploma education in the United States with a correlation coefficient (R) of 0.148 and weighted average of 89.2%, a difference of 2.2%.
High School Diploma Correlation Summary
| Measurement | Cajun | Spanish |
| Minimum | 58.4% | 60.9% |
| Maximum | 100.0% | 100.0% |
| Range | 41.6% | 39.1% |
| Mean | 83.6% | 89.2% |
| Median | 84.5% | 89.8% |
| Interquartile 25% (IQ1) | 79.8% | 86.0% |
| Interquartile 75% (IQ3) | 88.4% | 94.4% |
| Interquartile Range (IQR) | 8.7% | 8.4% |
| Standard Deviation (Sample) | 6.9% | 7.9% |
| Standard Deviation (Population) | 6.8% | 7.8% |
Similar Demographics by High School Diploma
Demographics Similar to Cajuns by High School Diploma
In terms of high school diploma, the demographic groups most similar to Cajuns are Seminole (87.3%, a difference of 0.020%), Immigrants from Peru (87.3%, a difference of 0.050%), Immigrants from Ghana (87.4%, a difference of 0.080%), Immigrants from Western Africa (87.4%, a difference of 0.080%), and Immigrants from South Eastern Asia (87.2%, a difference of 0.080%).
| Demographics | Rating | Rank | High School Diploma |
| Immigrants | Uruguay | 1.0 /100 | #253 | Tragic 87.6% |
| Immigrants | Colombia | 1.0 /100 | #254 | Tragic 87.6% |
| Immigrants | Senegal | 0.9 /100 | #255 | Tragic 87.6% |
| Africans | 0.7 /100 | #256 | Tragic 87.5% |
| Bahamians | 0.7 /100 | #257 | Tragic 87.5% |
| Immigrants | Ghana | 0.5 /100 | #258 | Tragic 87.4% |
| Immigrants | Western Africa | 0.5 /100 | #259 | Tragic 87.4% |
| Cajuns | 0.4 /100 | #260 | Tragic 87.3% |
| Seminole | 0.4 /100 | #261 | Tragic 87.3% |
| Immigrants | Peru | 0.4 /100 | #262 | Tragic 87.3% |
| Immigrants | South Eastern Asia | 0.3 /100 | #263 | Tragic 87.2% |
| Jamaicans | 0.3 /100 | #264 | Tragic 87.2% |
| U.S. Virgin Islanders | 0.2 /100 | #265 | Tragic 87.1% |
| Immigrants | Congo | 0.2 /100 | #266 | Tragic 87.0% |
| Blacks/African Americans | 0.2 /100 | #267 | Tragic 87.0% |
Demographics Similar to Spanish by High School Diploma
In terms of high school diploma, the demographic groups most similar to Spanish are Immigrants from Morocco (89.2%, a difference of 0.010%), Nonimmigrants (89.2%, a difference of 0.020%), Iroquois (89.2%, a difference of 0.030%), Delaware (89.2%, a difference of 0.040%), and Immigrants from Indonesia (89.1%, a difference of 0.040%).
| Demographics | Rating | Rank | High School Diploma |
| Immigrants | Nepal | 61.1 /100 | #164 | Good 89.3% |
| Immigrants | Asia | 59.8 /100 | #165 | Average 89.3% |
| Immigrants | Albania | 59.4 /100 | #166 | Average 89.3% |
| Immigrants | Hong Kong | 58.6 /100 | #167 | Average 89.3% |
| Delaware | 55.8 /100 | #168 | Average 89.2% |
| Iroquois | 55.1 /100 | #169 | Average 89.2% |
| Immigrants | Morocco | 53.3 /100 | #170 | Average 89.2% |
| Spanish | 52.9 /100 | #171 | Average 89.2% |
| Immigrants | Nonimmigrants | 51.8 /100 | #172 | Average 89.2% |
| Immigrants | Indonesia | 50.3 /100 | #173 | Average 89.1% |
| Hmong | 50.0 /100 | #174 | Average 89.1% |
| Immigrants | Western Asia | 49.0 /100 | #175 | Average 89.1% |
| Osage | 48.9 /100 | #176 | Average 89.1% |
| Sudanese | 48.5 /100 | #177 | Average 89.1% |
| Sierra Leoneans | 48.4 /100 | #178 | Average 89.1% |