Slovak vs Immigrants from Czechoslovakia No Schooling Completed
COMPARE
Slovak
Immigrants from Czechoslovakia
No Schooling Completed
No Schooling Completed Comparison
Slovaks
Immigrants from Czechoslovakia
1.3%
NO SCHOOLING COMPLETED
100.0/ 100
METRIC RATING
2nd/ 347
METRIC RANK
1.8%
NO SCHOOLING COMPLETED
97.9/ 100
METRIC RATING
101st/ 347
METRIC RANK
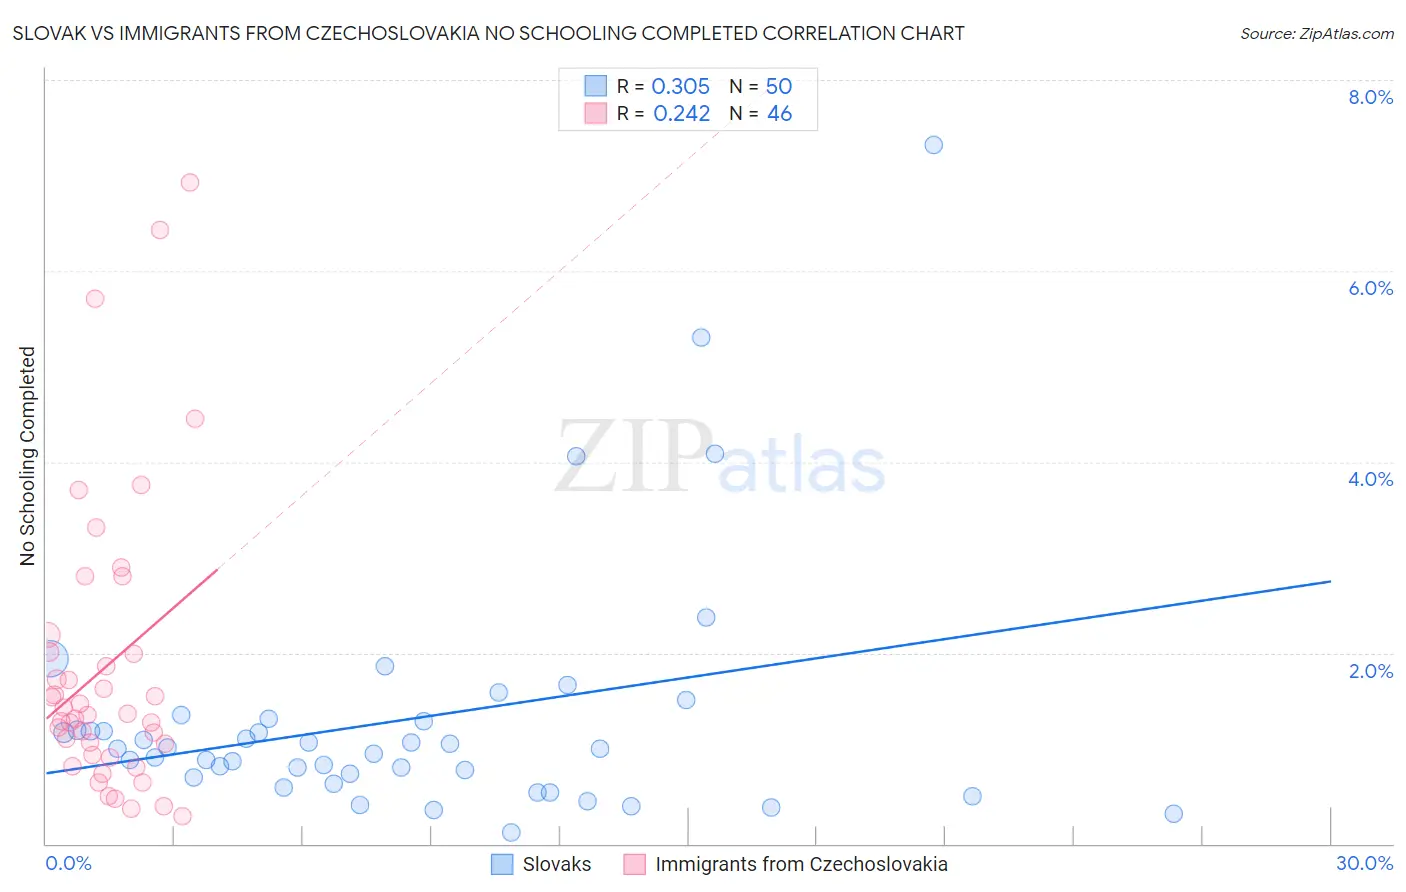
Slovak vs Immigrants from Czechoslovakia No Schooling Completed Correlation Chart
The statistical analysis conducted on geographies consisting of 391,654,464 people shows a mild positive correlation between the proportion of Slovaks and percentage of population with no schooling in the United States with a correlation coefficient (R) of 0.305 and weighted average of 1.3%. Similarly, the statistical analysis conducted on geographies consisting of 194,474,881 people shows a weak positive correlation between the proportion of Immigrants from Czechoslovakia and percentage of population with no schooling in the United States with a correlation coefficient (R) of 0.242 and weighted average of 1.8%, a difference of 35.7%.
No Schooling Completed Correlation Summary
| Measurement | Slovak | Immigrants from Czechoslovakia |
| Minimum | 0.11% | 0.29% |
| Maximum | 7.3% | 6.9% |
| Range | 7.2% | 6.6% |
| Mean | 1.3% | 1.9% |
| Median | 1.00% | 1.4% |
| Interquartile 25% (IQ1) | 0.70% | 0.93% |
| Interquartile 75% (IQ3) | 1.3% | 2.0% |
| Interquartile Range (IQR) | 0.59% | 1.1% |
| Standard Deviation (Sample) | 1.3% | 1.5% |
| Standard Deviation (Population) | 1.3% | 1.5% |
Similar Demographics by No Schooling Completed
Demographics Similar to Slovaks by No Schooling Completed
In terms of no schooling completed, the demographic groups most similar to Slovaks are Norwegian (1.3%, a difference of 0.43%), German (1.4%, a difference of 0.99%), Slovene (1.4%, a difference of 1.4%), Carpatho Rusyn (1.4%, a difference of 2.2%), and English (1.4%, a difference of 3.2%).
| Demographics | Rating | Rank | No Schooling Completed |
| Yup'ik | 100.0 /100 | #1 | Exceptional 1.2% |
| Slovaks | 100.0 /100 | #2 | Exceptional 1.3% |
| Norwegians | 100.0 /100 | #3 | Exceptional 1.3% |
| Germans | 100.0 /100 | #4 | Exceptional 1.4% |
| Slovenes | 100.0 /100 | #5 | Exceptional 1.4% |
| Carpatho Rusyns | 100.0 /100 | #6 | Exceptional 1.4% |
| English | 100.0 /100 | #7 | Exceptional 1.4% |
| Swedes | 100.0 /100 | #8 | Exceptional 1.4% |
| Scottish | 100.0 /100 | #9 | Exceptional 1.4% |
| Dutch | 100.0 /100 | #10 | Exceptional 1.4% |
| Lithuanians | 100.0 /100 | #11 | Exceptional 1.4% |
| Irish | 100.0 /100 | #12 | Exceptional 1.4% |
| Poles | 100.0 /100 | #13 | Exceptional 1.4% |
| Scotch-Irish | 100.0 /100 | #14 | Exceptional 1.5% |
| Tlingit-Haida | 100.0 /100 | #15 | Exceptional 1.5% |
Demographics Similar to Immigrants from Czechoslovakia by No Schooling Completed
In terms of no schooling completed, the demographic groups most similar to Immigrants from Czechoslovakia are Immigrants from Switzerland (1.8%, a difference of 0.0%), Basque (1.8%, a difference of 0.060%), Immigrants from Singapore (1.8%, a difference of 0.30%), Choctaw (1.8%, a difference of 0.49%), and Thai (1.8%, a difference of 0.63%).
| Demographics | Rating | Rank | No Schooling Completed |
| Immigrants | Nonimmigrants | 98.5 /100 | #94 | Exceptional 1.8% |
| Puget Sound Salish | 98.5 /100 | #95 | Exceptional 1.8% |
| Bhutanese | 98.4 /100 | #96 | Exceptional 1.8% |
| Immigrants | Ireland | 98.4 /100 | #97 | Exceptional 1.8% |
| Iranians | 98.2 /100 | #98 | Exceptional 1.8% |
| Choctaw | 98.1 /100 | #99 | Exceptional 1.8% |
| Immigrants | Singapore | 98.0 /100 | #100 | Exceptional 1.8% |
| Immigrants | Czechoslovakia | 97.9 /100 | #101 | Exceptional 1.8% |
| Immigrants | Switzerland | 97.9 /100 | #102 | Exceptional 1.8% |
| Basques | 97.9 /100 | #103 | Exceptional 1.8% |
| Thais | 97.5 /100 | #104 | Exceptional 1.8% |
| German Russians | 97.5 /100 | #105 | Exceptional 1.8% |
| Immigrants | France | 97.3 /100 | #106 | Exceptional 1.8% |
| Yugoslavians | 97.2 /100 | #107 | Exceptional 1.8% |
| Okinawans | 97.1 /100 | #108 | Exceptional 1.8% |