Egyptian vs Immigrants from Czechoslovakia No Schooling Completed
COMPARE
Egyptian
Immigrants from Czechoslovakia
No Schooling Completed
No Schooling Completed Comparison
Egyptians
Immigrants from Czechoslovakia
2.1%
NO SCHOOLING COMPLETED
59.2/ 100
METRIC RATING
167th/ 347
METRIC RANK
1.8%
NO SCHOOLING COMPLETED
97.9/ 100
METRIC RATING
101st/ 347
METRIC RANK
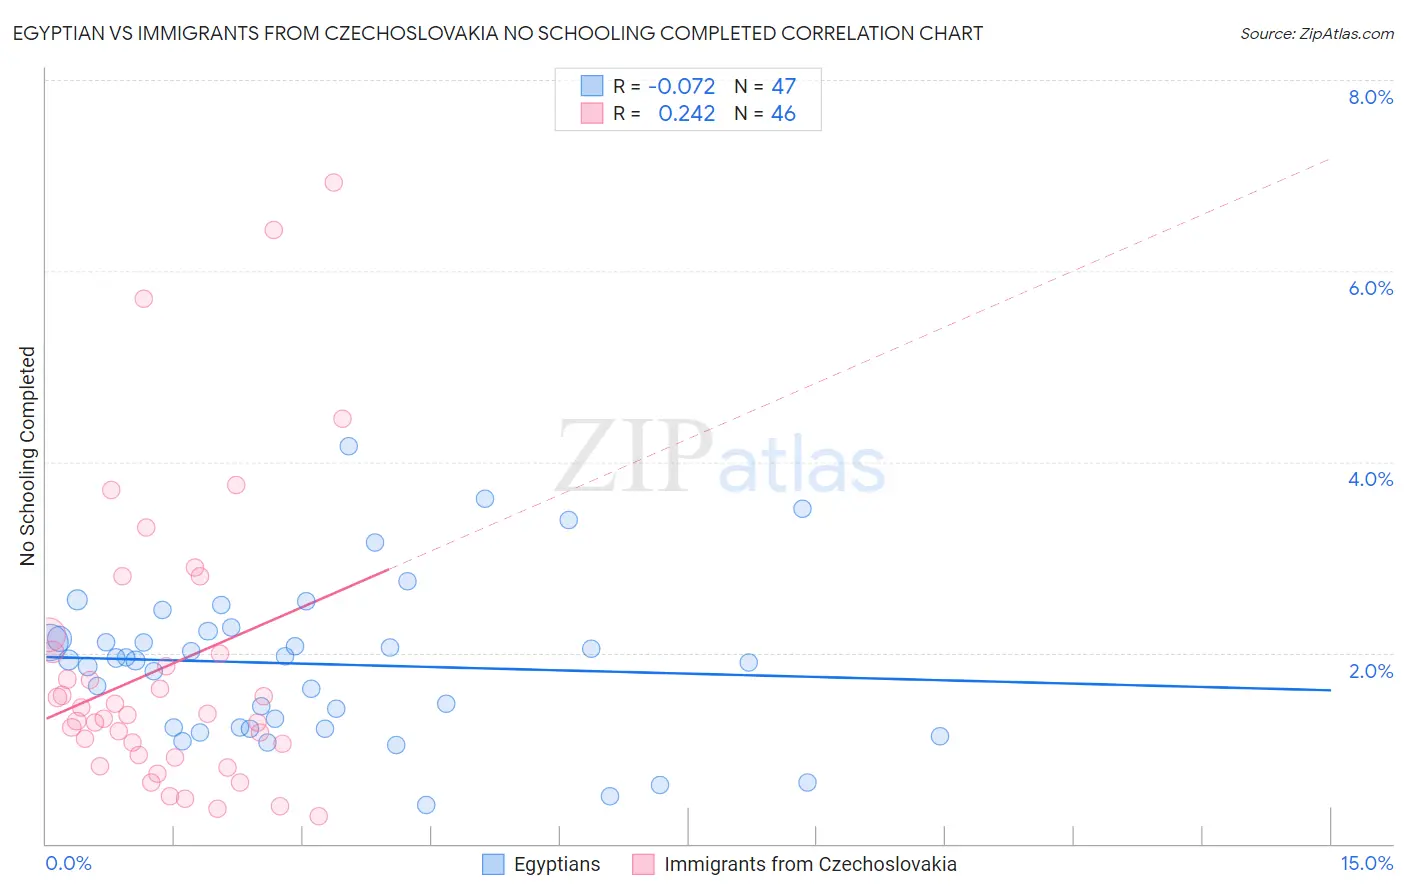
Egyptian vs Immigrants from Czechoslovakia No Schooling Completed Correlation Chart
The statistical analysis conducted on geographies consisting of 275,573,991 people shows a slight negative correlation between the proportion of Egyptians and percentage of population with no schooling in the United States with a correlation coefficient (R) of -0.072 and weighted average of 2.1%. Similarly, the statistical analysis conducted on geographies consisting of 194,474,881 people shows a weak positive correlation between the proportion of Immigrants from Czechoslovakia and percentage of population with no schooling in the United States with a correlation coefficient (R) of 0.242 and weighted average of 1.8%, a difference of 13.4%.
No Schooling Completed Correlation Summary
| Measurement | Egyptian | Immigrants from Czechoslovakia |
| Minimum | 0.40% | 0.29% |
| Maximum | 4.2% | 6.9% |
| Range | 3.8% | 6.6% |
| Mean | 1.9% | 1.9% |
| Median | 1.9% | 1.4% |
| Interquartile 25% (IQ1) | 1.2% | 0.93% |
| Interquartile 75% (IQ3) | 2.2% | 2.0% |
| Interquartile Range (IQR) | 1.0% | 1.1% |
| Standard Deviation (Sample) | 0.82% | 1.5% |
| Standard Deviation (Population) | 0.81% | 1.5% |
Similar Demographics by No Schooling Completed
Demographics Similar to Egyptians by No Schooling Completed
In terms of no schooling completed, the demographic groups most similar to Egyptians are Cheyenne (2.1%, a difference of 0.080%), Dutch West Indian (2.1%, a difference of 0.10%), Brazilian (2.1%, a difference of 0.15%), Comanche (2.1%, a difference of 0.21%), and Apache (2.1%, a difference of 0.35%).
| Demographics | Rating | Rank | No Schooling Completed |
| Kenyans | 65.7 /100 | #160 | Good 2.0% |
| Ugandans | 64.6 /100 | #161 | Good 2.0% |
| Immigrants | Brazil | 63.8 /100 | #162 | Good 2.1% |
| Albanians | 62.2 /100 | #163 | Good 2.1% |
| Comanche | 60.7 /100 | #164 | Good 2.1% |
| Brazilians | 60.2 /100 | #165 | Good 2.1% |
| Dutch West Indians | 59.9 /100 | #166 | Average 2.1% |
| Egyptians | 59.2 /100 | #167 | Average 2.1% |
| Cheyenne | 58.6 /100 | #168 | Average 2.1% |
| Apache | 56.7 /100 | #169 | Average 2.1% |
| Argentineans | 56.0 /100 | #170 | Average 2.1% |
| Immigrants | Poland | 55.2 /100 | #171 | Average 2.1% |
| Immigrants | Argentina | 52.7 /100 | #172 | Average 2.1% |
| Immigrants | Belarus | 51.8 /100 | #173 | Average 2.1% |
| Immigrants | Micronesia | 50.0 /100 | #174 | Average 2.1% |
Demographics Similar to Immigrants from Czechoslovakia by No Schooling Completed
In terms of no schooling completed, the demographic groups most similar to Immigrants from Czechoslovakia are Immigrants from Switzerland (1.8%, a difference of 0.0%), Basque (1.8%, a difference of 0.060%), Immigrants from Singapore (1.8%, a difference of 0.30%), Choctaw (1.8%, a difference of 0.49%), and Thai (1.8%, a difference of 0.63%).
| Demographics | Rating | Rank | No Schooling Completed |
| Immigrants | Nonimmigrants | 98.5 /100 | #94 | Exceptional 1.8% |
| Puget Sound Salish | 98.5 /100 | #95 | Exceptional 1.8% |
| Bhutanese | 98.4 /100 | #96 | Exceptional 1.8% |
| Immigrants | Ireland | 98.4 /100 | #97 | Exceptional 1.8% |
| Iranians | 98.2 /100 | #98 | Exceptional 1.8% |
| Choctaw | 98.1 /100 | #99 | Exceptional 1.8% |
| Immigrants | Singapore | 98.0 /100 | #100 | Exceptional 1.8% |
| Immigrants | Czechoslovakia | 97.9 /100 | #101 | Exceptional 1.8% |
| Immigrants | Switzerland | 97.9 /100 | #102 | Exceptional 1.8% |
| Basques | 97.9 /100 | #103 | Exceptional 1.8% |
| Thais | 97.5 /100 | #104 | Exceptional 1.8% |
| German Russians | 97.5 /100 | #105 | Exceptional 1.8% |
| Immigrants | France | 97.3 /100 | #106 | Exceptional 1.8% |
| Yugoslavians | 97.2 /100 | #107 | Exceptional 1.8% |
| Okinawans | 97.1 /100 | #108 | Exceptional 1.8% |