Bulgarian vs Jamaican College, 1 year or more
COMPARE
Bulgarian
Jamaican
College, 1 year or more
College, 1 year or more Comparison
Bulgarians
Jamaicans
65.5%
COLLEGE, 1 YEAR OR MORE
100.0/ 100
METRIC RATING
32nd/ 347
METRIC RANK
54.9%
COLLEGE, 1 YEAR OR MORE
0.3/ 100
METRIC RATING
260th/ 347
METRIC RANK
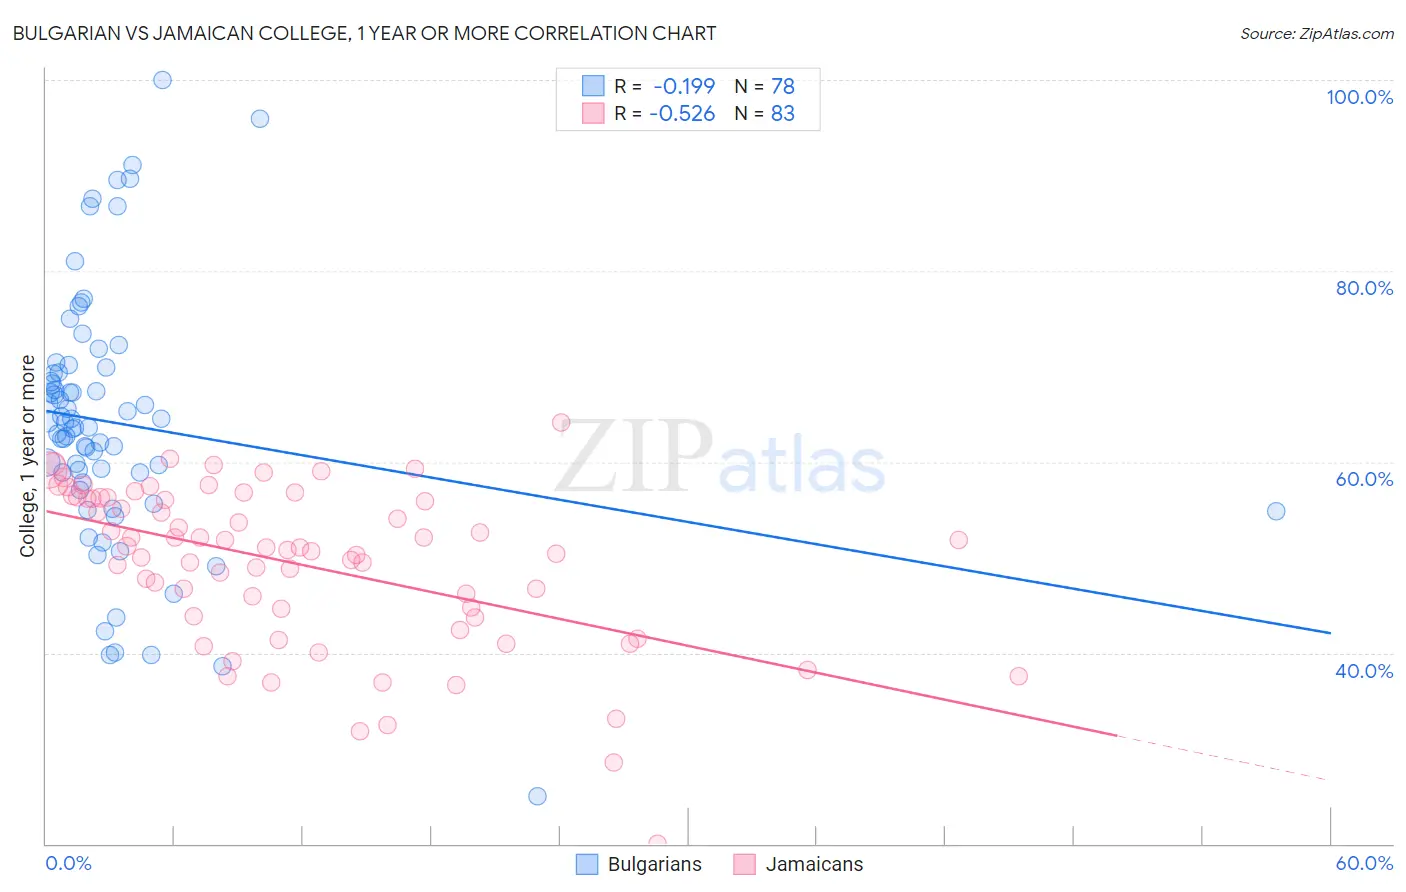
Bulgarian vs Jamaican College, 1 year or more Correlation Chart
The statistical analysis conducted on geographies consisting of 205,631,725 people shows a poor negative correlation between the proportion of Bulgarians and percentage of population with at least college, 1 year or more education in the United States with a correlation coefficient (R) of -0.199 and weighted average of 65.5%. Similarly, the statistical analysis conducted on geographies consisting of 368,077,485 people shows a substantial negative correlation between the proportion of Jamaicans and percentage of population with at least college, 1 year or more education in the United States with a correlation coefficient (R) of -0.526 and weighted average of 54.9%, a difference of 19.4%.
College, 1 year or more Correlation Summary
| Measurement | Bulgarian | Jamaican |
| Minimum | 25.0% | 20.1% |
| Maximum | 100.0% | 64.1% |
| Range | 75.0% | 44.0% |
| Mean | 64.0% | 49.3% |
| Median | 63.9% | 51.0% |
| Interquartile 25% (IQ1) | 57.8% | 43.8% |
| Interquartile 75% (IQ3) | 69.4% | 56.2% |
| Interquartile Range (IQR) | 11.5% | 12.4% |
| Standard Deviation (Sample) | 13.5% | 8.5% |
| Standard Deviation (Population) | 13.4% | 8.4% |
Similar Demographics by College, 1 year or more
Demographics Similar to Bulgarians by College, 1 year or more
In terms of college, 1 year or more, the demographic groups most similar to Bulgarians are Turkish (65.5%, a difference of 0.050%), Immigrants from Denmark (65.6%, a difference of 0.13%), Immigrants from Sri Lanka (65.4%, a difference of 0.15%), Immigrants from Northern Europe (65.6%, a difference of 0.24%), and Israeli (65.3%, a difference of 0.27%).
| Demographics | Rating | Rank | College, 1 year or more |
| Indians (Asian) | 100.0 /100 | #25 | Exceptional 66.1% |
| Latvians | 100.0 /100 | #26 | Exceptional 66.1% |
| Immigrants | Ireland | 100.0 /100 | #27 | Exceptional 65.9% |
| Immigrants | France | 100.0 /100 | #28 | Exceptional 65.8% |
| Immigrants | Northern Europe | 100.0 /100 | #29 | Exceptional 65.6% |
| Immigrants | Denmark | 100.0 /100 | #30 | Exceptional 65.6% |
| Turks | 100.0 /100 | #31 | Exceptional 65.5% |
| Bulgarians | 100.0 /100 | #32 | Exceptional 65.5% |
| Immigrants | Sri Lanka | 99.9 /100 | #33 | Exceptional 65.4% |
| Israelis | 99.9 /100 | #34 | Exceptional 65.3% |
| Immigrants | Turkey | 99.9 /100 | #35 | Exceptional 65.2% |
| Immigrants | South Africa | 99.9 /100 | #36 | Exceptional 65.1% |
| Russians | 99.9 /100 | #37 | Exceptional 65.1% |
| Immigrants | Saudi Arabia | 99.9 /100 | #38 | Exceptional 65.0% |
| Estonians | 99.9 /100 | #39 | Exceptional 65.0% |
Demographics Similar to Jamaicans by College, 1 year or more
In terms of college, 1 year or more, the demographic groups most similar to Jamaicans are Ottawa (54.9%, a difference of 0.030%), Nepalese (54.9%, a difference of 0.10%), Immigrants from St. Vincent and the Grenadines (54.8%, a difference of 0.11%), U.S. Virgin Islander (54.8%, a difference of 0.13%), and African (55.0%, a difference of 0.16%).
| Demographics | Rating | Rank | College, 1 year or more |
| Immigrants | Barbados | 0.6 /100 | #253 | Tragic 55.4% |
| Japanese | 0.5 /100 | #254 | Tragic 55.2% |
| Immigrants | Bahamas | 0.5 /100 | #255 | Tragic 55.2% |
| Immigrants | West Indies | 0.5 /100 | #256 | Tragic 55.2% |
| Indonesians | 0.4 /100 | #257 | Tragic 55.1% |
| Africans | 0.4 /100 | #258 | Tragic 55.0% |
| Nepalese | 0.3 /100 | #259 | Tragic 54.9% |
| Jamaicans | 0.3 /100 | #260 | Tragic 54.9% |
| Ottawa | 0.3 /100 | #261 | Tragic 54.9% |
| Immigrants | St. Vincent and the Grenadines | 0.3 /100 | #262 | Tragic 54.8% |
| U.S. Virgin Islanders | 0.3 /100 | #263 | Tragic 54.8% |
| Immigrants | Micronesia | 0.3 /100 | #264 | Tragic 54.8% |
| Immigrants | Laos | 0.2 /100 | #265 | Tragic 54.7% |
| Potawatomi | 0.2 /100 | #266 | Tragic 54.6% |
| Blackfeet | 0.2 /100 | #267 | Tragic 54.6% |