Bulgarian vs Immigrants from Lebanon College, 1 year or more
COMPARE
Bulgarian
Immigrants from Lebanon
College, 1 year or more
College, 1 year or more Comparison
Bulgarians
Immigrants from Lebanon
65.5%
COLLEGE, 1 YEAR OR MORE
100.0/ 100
METRIC RATING
32nd/ 347
METRIC RANK
62.9%
COLLEGE, 1 YEAR OR MORE
98.8/ 100
METRIC RATING
78th/ 347
METRIC RANK
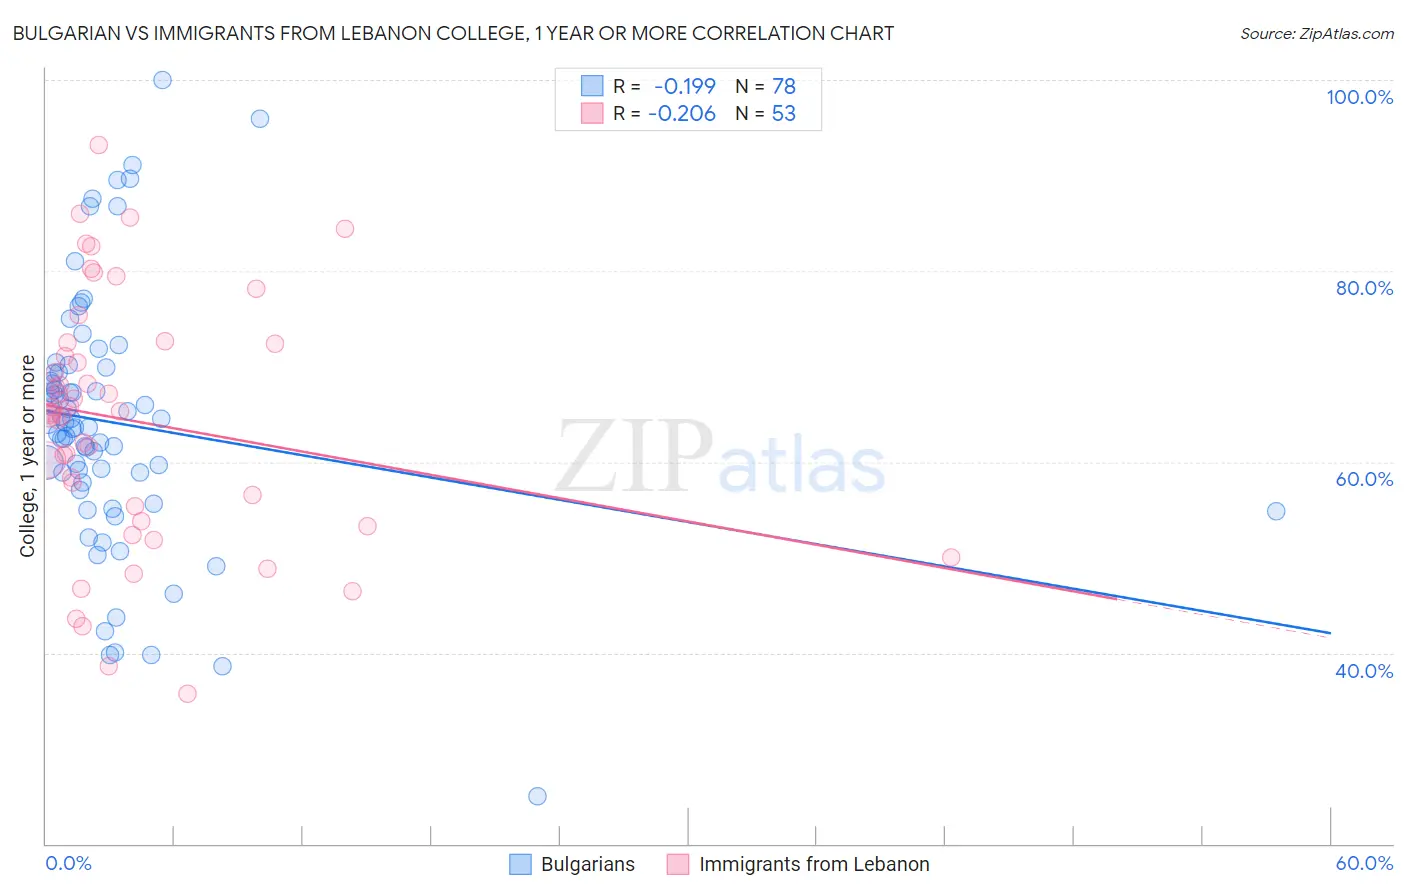
Bulgarian vs Immigrants from Lebanon College, 1 year or more Correlation Chart
The statistical analysis conducted on geographies consisting of 205,631,725 people shows a poor negative correlation between the proportion of Bulgarians and percentage of population with at least college, 1 year or more education in the United States with a correlation coefficient (R) of -0.199 and weighted average of 65.5%. Similarly, the statistical analysis conducted on geographies consisting of 217,164,247 people shows a weak negative correlation between the proportion of Immigrants from Lebanon and percentage of population with at least college, 1 year or more education in the United States with a correlation coefficient (R) of -0.206 and weighted average of 62.9%, a difference of 4.1%.
College, 1 year or more Correlation Summary
| Measurement | Bulgarian | Immigrants from Lebanon |
| Minimum | 25.0% | 35.7% |
| Maximum | 100.0% | 93.2% |
| Range | 75.0% | 57.5% |
| Mean | 64.0% | 64.3% |
| Median | 63.9% | 65.2% |
| Interquartile 25% (IQ1) | 57.8% | 54.6% |
| Interquartile 75% (IQ3) | 69.4% | 72.4% |
| Interquartile Range (IQR) | 11.5% | 17.8% |
| Standard Deviation (Sample) | 13.5% | 13.0% |
| Standard Deviation (Population) | 13.4% | 12.9% |
Similar Demographics by College, 1 year or more
Demographics Similar to Bulgarians by College, 1 year or more
In terms of college, 1 year or more, the demographic groups most similar to Bulgarians are Turkish (65.5%, a difference of 0.050%), Immigrants from Denmark (65.6%, a difference of 0.13%), Immigrants from Sri Lanka (65.4%, a difference of 0.15%), Immigrants from Northern Europe (65.6%, a difference of 0.24%), and Israeli (65.3%, a difference of 0.27%).
| Demographics | Rating | Rank | College, 1 year or more |
| Indians (Asian) | 100.0 /100 | #25 | Exceptional 66.1% |
| Latvians | 100.0 /100 | #26 | Exceptional 66.1% |
| Immigrants | Ireland | 100.0 /100 | #27 | Exceptional 65.9% |
| Immigrants | France | 100.0 /100 | #28 | Exceptional 65.8% |
| Immigrants | Northern Europe | 100.0 /100 | #29 | Exceptional 65.6% |
| Immigrants | Denmark | 100.0 /100 | #30 | Exceptional 65.6% |
| Turks | 100.0 /100 | #31 | Exceptional 65.5% |
| Bulgarians | 100.0 /100 | #32 | Exceptional 65.5% |
| Immigrants | Sri Lanka | 99.9 /100 | #33 | Exceptional 65.4% |
| Israelis | 99.9 /100 | #34 | Exceptional 65.3% |
| Immigrants | Turkey | 99.9 /100 | #35 | Exceptional 65.2% |
| Immigrants | South Africa | 99.9 /100 | #36 | Exceptional 65.1% |
| Russians | 99.9 /100 | #37 | Exceptional 65.1% |
| Immigrants | Saudi Arabia | 99.9 /100 | #38 | Exceptional 65.0% |
| Estonians | 99.9 /100 | #39 | Exceptional 65.0% |
Demographics Similar to Immigrants from Lebanon by College, 1 year or more
In terms of college, 1 year or more, the demographic groups most similar to Immigrants from Lebanon are Northern European (62.9%, a difference of 0.010%), Paraguayan (62.9%, a difference of 0.020%), Ethiopian (62.9%, a difference of 0.020%), Lithuanian (62.9%, a difference of 0.050%), and Laotian (62.8%, a difference of 0.11%).
| Demographics | Rating | Rank | College, 1 year or more |
| Immigrants | Canada | 99.1 /100 | #71 | Exceptional 63.1% |
| Egyptians | 99.0 /100 | #72 | Exceptional 63.1% |
| Immigrants | Moldova | 99.0 /100 | #73 | Exceptional 63.0% |
| Immigrants | North America | 99.0 /100 | #74 | Exceptional 63.0% |
| Armenians | 98.9 /100 | #75 | Exceptional 63.0% |
| Paraguayans | 98.8 /100 | #76 | Exceptional 62.9% |
| Ethiopians | 98.8 /100 | #77 | Exceptional 62.9% |
| Immigrants | Lebanon | 98.8 /100 | #78 | Exceptional 62.9% |
| Northern Europeans | 98.8 /100 | #79 | Exceptional 62.9% |
| Lithuanians | 98.8 /100 | #80 | Exceptional 62.9% |
| Laotians | 98.7 /100 | #81 | Exceptional 62.8% |
| Immigrants | Bolivia | 98.7 /100 | #82 | Exceptional 62.8% |
| Immigrants | Argentina | 98.6 /100 | #83 | Exceptional 62.8% |
| Immigrants | England | 98.6 /100 | #84 | Exceptional 62.8% |
| Immigrants | Pakistan | 98.6 /100 | #85 | Exceptional 62.8% |