Immigrants from China vs Tsimshian College, 1 year or more
COMPARE
Immigrants from China
Tsimshian
College, 1 year or more
College, 1 year or more Comparison
Immigrants from China
Tsimshian
66.4%
COLLEGE, 1 YEAR OR MORE
100.0/ 100
METRIC RATING
23rd/ 347
METRIC RANK
57.9%
COLLEGE, 1 YEAR OR MORE
13.5/ 100
METRIC RATING
210th/ 347
METRIC RANK
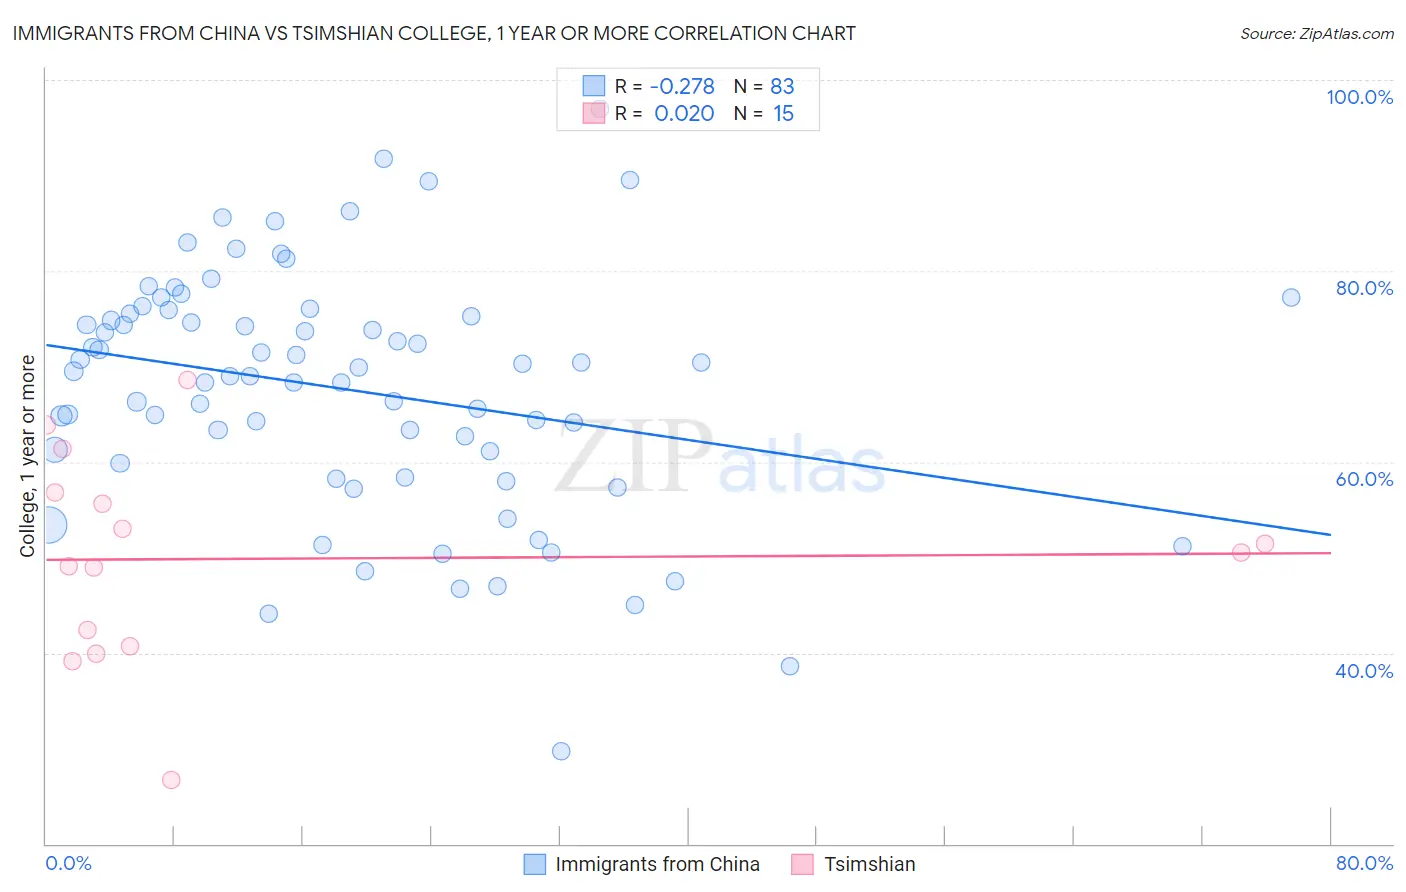
Immigrants from China vs Tsimshian College, 1 year or more Correlation Chart
The statistical analysis conducted on geographies consisting of 457,078,071 people shows a weak negative correlation between the proportion of Immigrants from China and percentage of population with at least college, 1 year or more education in the United States with a correlation coefficient (R) of -0.278 and weighted average of 66.4%. Similarly, the statistical analysis conducted on geographies consisting of 15,626,544 people shows no correlation between the proportion of Tsimshian and percentage of population with at least college, 1 year or more education in the United States with a correlation coefficient (R) of 0.020 and weighted average of 57.9%, a difference of 14.5%.
College, 1 year or more Correlation Summary
| Measurement | Immigrants from China | Tsimshian |
| Minimum | 29.7% | 26.7% |
| Maximum | 97.0% | 68.6% |
| Range | 67.3% | 41.9% |
| Mean | 67.6% | 49.9% |
| Median | 69.5% | 50.5% |
| Interquartile 25% (IQ1) | 59.9% | 40.7% |
| Interquartile 75% (IQ3) | 75.5% | 56.8% |
| Interquartile Range (IQR) | 15.7% | 16.1% |
| Standard Deviation (Sample) | 12.7% | 10.9% |
| Standard Deviation (Population) | 12.6% | 10.6% |
Similar Demographics by College, 1 year or more
Demographics Similar to Immigrants from China by College, 1 year or more
In terms of college, 1 year or more, the demographic groups most similar to Immigrants from China are Soviet Union (66.4%, a difference of 0.060%), Immigrants from Belgium (66.3%, a difference of 0.080%), Immigrants from Hong Kong (66.4%, a difference of 0.12%), Immigrants from Korea (66.5%, a difference of 0.19%), and Immigrants from Switzerland (66.5%, a difference of 0.23%).
| Demographics | Rating | Rank | College, 1 year or more |
| Immigrants | Japan | 100.0 /100 | #16 | Exceptional 66.7% |
| Immigrants | Eastern Asia | 100.0 /100 | #17 | Exceptional 66.6% |
| Eastern Europeans | 100.0 /100 | #18 | Exceptional 66.6% |
| Immigrants | Switzerland | 100.0 /100 | #19 | Exceptional 66.5% |
| Immigrants | Korea | 100.0 /100 | #20 | Exceptional 66.5% |
| Immigrants | Hong Kong | 100.0 /100 | #21 | Exceptional 66.4% |
| Soviet Union | 100.0 /100 | #22 | Exceptional 66.4% |
| Immigrants | China | 100.0 /100 | #23 | Exceptional 66.4% |
| Immigrants | Belgium | 100.0 /100 | #24 | Exceptional 66.3% |
| Indians (Asian) | 100.0 /100 | #25 | Exceptional 66.1% |
| Latvians | 100.0 /100 | #26 | Exceptional 66.1% |
| Immigrants | Ireland | 100.0 /100 | #27 | Exceptional 65.9% |
| Immigrants | France | 100.0 /100 | #28 | Exceptional 65.8% |
| Immigrants | Northern Europe | 100.0 /100 | #29 | Exceptional 65.6% |
| Immigrants | Denmark | 100.0 /100 | #30 | Exceptional 65.6% |
Demographics Similar to Tsimshian by College, 1 year or more
In terms of college, 1 year or more, the demographic groups most similar to Tsimshian are Immigrants from Nigeria (57.9%, a difference of 0.020%), Immigrants from Middle Africa (58.0%, a difference of 0.060%), Immigrants from Uruguay (58.1%, a difference of 0.19%), Immigrants from Senegal (57.8%, a difference of 0.20%), and French Canadian (57.8%, a difference of 0.20%).
| Demographics | Rating | Rank | College, 1 year or more |
| Ghanaians | 20.9 /100 | #203 | Fair 58.4% |
| Panamanians | 19.2 /100 | #204 | Poor 58.3% |
| Immigrants | Zaire | 18.7 /100 | #205 | Poor 58.3% |
| Immigrants | Vietnam | 18.2 /100 | #206 | Poor 58.2% |
| Senegalese | 16.9 /100 | #207 | Poor 58.2% |
| Immigrants | Uruguay | 15.2 /100 | #208 | Poor 58.1% |
| Immigrants | Middle Africa | 14.0 /100 | #209 | Poor 58.0% |
| Tsimshian | 13.5 /100 | #210 | Poor 57.9% |
| Immigrants | Nigeria | 13.3 /100 | #211 | Poor 57.9% |
| Immigrants | Senegal | 11.8 /100 | #212 | Poor 57.8% |
| French Canadians | 11.8 /100 | #213 | Poor 57.8% |
| Immigrants | Colombia | 11.6 /100 | #214 | Poor 57.8% |
| Tongans | 11.6 /100 | #215 | Poor 57.8% |
| Immigrants | Peru | 10.6 /100 | #216 | Poor 57.7% |
| Immigrants | Panama | 9.1 /100 | #217 | Tragic 57.6% |