Serbian vs Marshallese College, 1 year or more
COMPARE
Serbian
Marshallese
College, 1 year or more
College, 1 year or more Comparison
Serbians
Marshallese
61.4%
COLLEGE, 1 YEAR OR MORE
92.2/ 100
METRIC RATING
123rd/ 347
METRIC RANK
55.8%
COLLEGE, 1 YEAR OR MORE
1.0/ 100
METRIC RATING
242nd/ 347
METRIC RANK
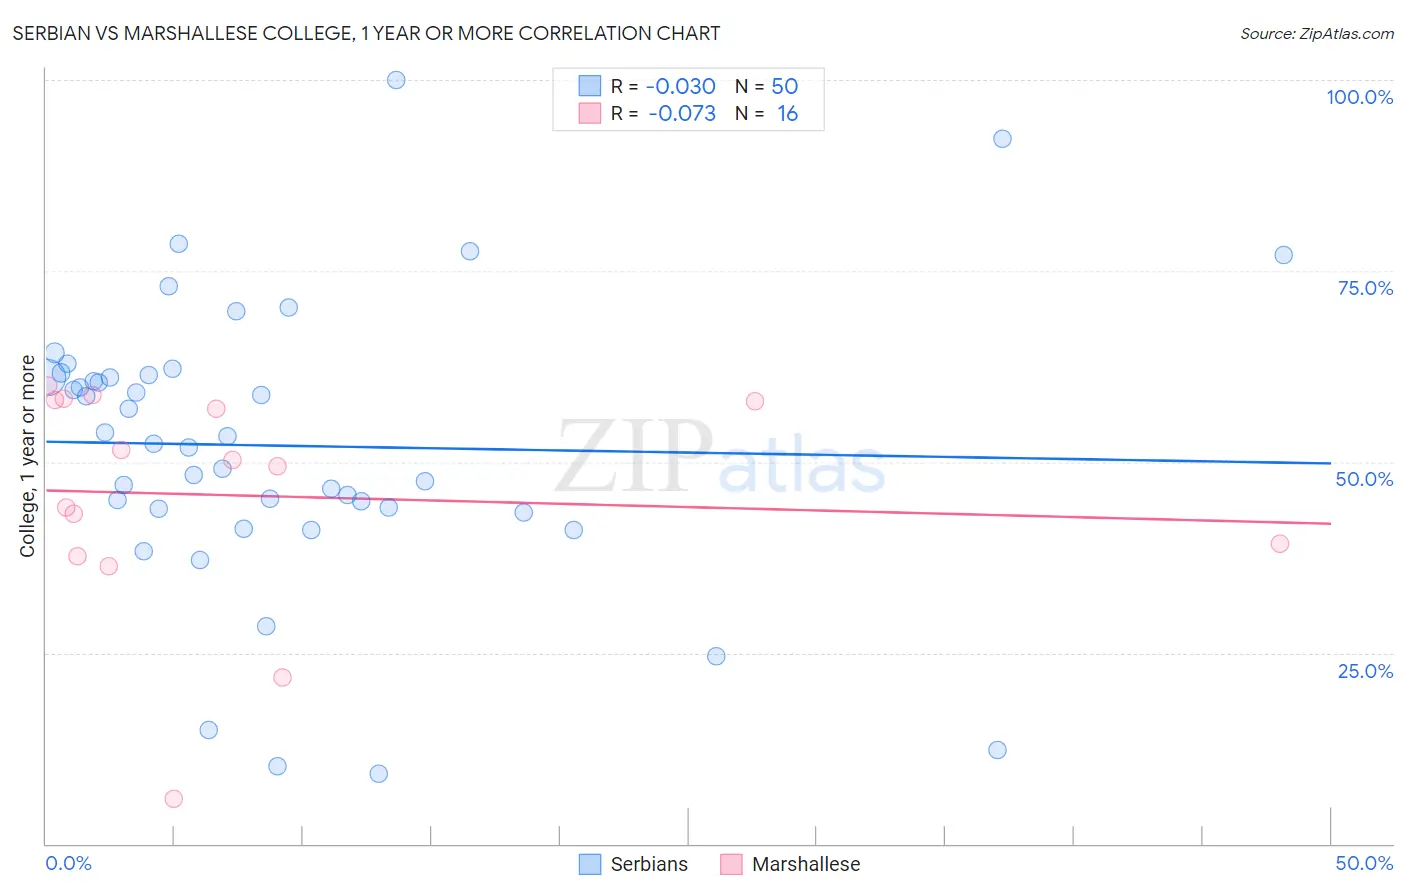
Serbian vs Marshallese College, 1 year or more Correlation Chart
The statistical analysis conducted on geographies consisting of 267,640,905 people shows no correlation between the proportion of Serbians and percentage of population with at least college, 1 year or more education in the United States with a correlation coefficient (R) of -0.030 and weighted average of 61.4%. Similarly, the statistical analysis conducted on geographies consisting of 14,761,315 people shows a slight negative correlation between the proportion of Marshallese and percentage of population with at least college, 1 year or more education in the United States with a correlation coefficient (R) of -0.073 and weighted average of 55.8%, a difference of 10.0%.
College, 1 year or more Correlation Summary
| Measurement | Serbian | Marshallese |
| Minimum | 9.2% | 5.9% |
| Maximum | 100.0% | 60.0% |
| Range | 90.8% | 54.1% |
| Mean | 52.1% | 45.6% |
| Median | 52.9% | 49.9% |
| Interquartile 25% (IQ1) | 43.9% | 38.5% |
| Interquartile 75% (IQ3) | 61.3% | 58.0% |
| Interquartile Range (IQR) | 17.4% | 19.5% |
| Standard Deviation (Sample) | 18.8% | 15.0% |
| Standard Deviation (Population) | 18.6% | 14.6% |
Similar Demographics by College, 1 year or more
Demographics Similar to Serbians by College, 1 year or more
In terms of college, 1 year or more, the demographic groups most similar to Serbians are Immigrants from Chile (61.4%, a difference of 0.010%), Venezuelan (61.3%, a difference of 0.030%), Immigrants from Jordan (61.4%, a difference of 0.10%), Immigrants from Syria (61.3%, a difference of 0.11%), and Alsatian (61.3%, a difference of 0.15%).
| Demographics | Rating | Rank | College, 1 year or more |
| Lebanese | 94.1 /100 | #116 | Exceptional 61.6% |
| Arabs | 93.9 /100 | #117 | Exceptional 61.6% |
| Immigrants | Brazil | 93.9 /100 | #118 | Exceptional 61.6% |
| Assyrians/Chaldeans/Syriacs | 93.3 /100 | #119 | Exceptional 61.5% |
| Pakistanis | 93.2 /100 | #120 | Exceptional 61.5% |
| Immigrants | Jordan | 92.7 /100 | #121 | Exceptional 61.4% |
| Immigrants | Chile | 92.3 /100 | #122 | Exceptional 61.4% |
| Serbians | 92.2 /100 | #123 | Exceptional 61.4% |
| Venezuelans | 92.1 /100 | #124 | Exceptional 61.3% |
| Immigrants | Syria | 91.6 /100 | #125 | Exceptional 61.3% |
| Alsatians | 91.3 /100 | #126 | Exceptional 61.3% |
| Immigrants | Eastern Africa | 91.1 /100 | #127 | Exceptional 61.2% |
| Immigrants | Italy | 91.1 /100 | #128 | Exceptional 61.2% |
| Ugandans | 90.7 /100 | #129 | Exceptional 61.2% |
| Italians | 89.5 /100 | #130 | Excellent 61.1% |
Demographics Similar to Marshallese by College, 1 year or more
In terms of college, 1 year or more, the demographic groups most similar to Marshallese are Osage (55.8%, a difference of 0.010%), French American Indian (55.8%, a difference of 0.11%), Chippewa (55.7%, a difference of 0.13%), Trinidadian and Tobagonian (55.8%, a difference of 0.15%), and Immigrants from Liberia (55.7%, a difference of 0.20%).
| Demographics | Rating | Rank | College, 1 year or more |
| West Indians | 1.8 /100 | #235 | Tragic 56.3% |
| Iroquois | 1.7 /100 | #236 | Tragic 56.2% |
| Samoans | 1.6 /100 | #237 | Tragic 56.2% |
| Barbadians | 1.3 /100 | #238 | Tragic 56.0% |
| Puget Sound Salish | 1.1 /100 | #239 | Tragic 55.9% |
| Trinidadians and Tobagonians | 1.1 /100 | #240 | Tragic 55.8% |
| French American Indians | 1.0 /100 | #241 | Tragic 55.8% |
| Marshallese | 1.0 /100 | #242 | Tragic 55.8% |
| Osage | 1.0 /100 | #243 | Tragic 55.8% |
| Chippewa | 0.9 /100 | #244 | Tragic 55.7% |
| Immigrants | Liberia | 0.8 /100 | #245 | Tragic 55.7% |
| Malaysians | 0.8 /100 | #246 | Tragic 55.6% |
| Hawaiians | 0.8 /100 | #247 | Tragic 55.6% |
| Immigrants | Congo | 0.8 /100 | #248 | Tragic 55.6% |
| Immigrants | Trinidad and Tobago | 0.7 /100 | #249 | Tragic 55.5% |