British West Indian vs Cajun Associate's Degree
COMPARE
British West Indian
Cajun
Associate's Degree
Associate's Degree Comparison
British West Indians
Cajuns
42.4%
ASSOCIATE'S DEGREE
1.0/ 100
METRIC RATING
241st/ 347
METRIC RANK
37.4%
ASSOCIATE'S DEGREE
0.0/ 100
METRIC RATING
320th/ 347
METRIC RANK
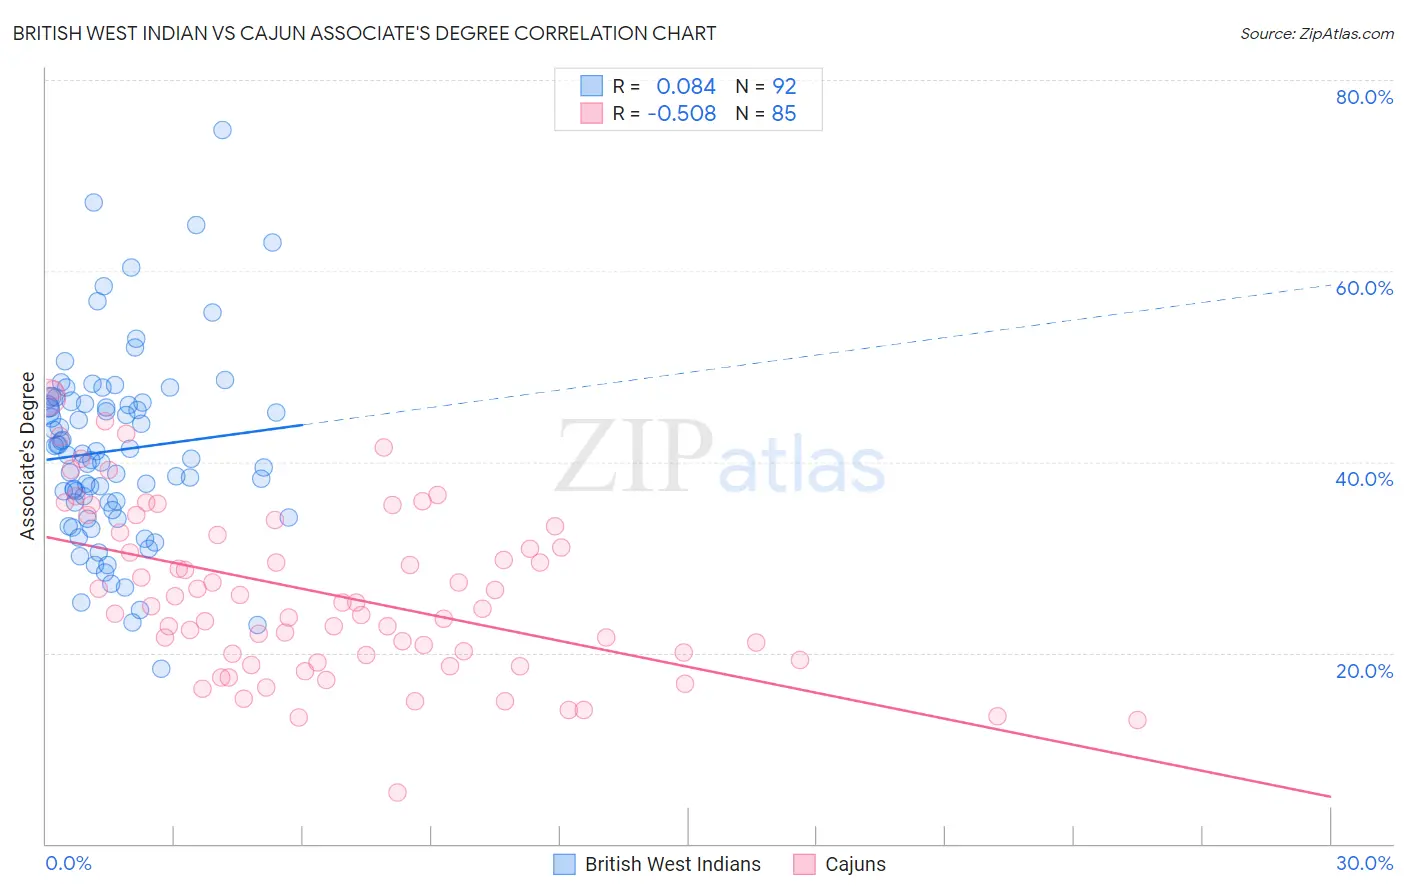
British West Indian vs Cajun Associate's Degree Correlation Chart
The statistical analysis conducted on geographies consisting of 152,683,655 people shows a slight positive correlation between the proportion of British West Indians and percentage of population with at least associate's degree education in the United States with a correlation coefficient (R) of 0.084 and weighted average of 42.4%. Similarly, the statistical analysis conducted on geographies consisting of 149,710,978 people shows a substantial negative correlation between the proportion of Cajuns and percentage of population with at least associate's degree education in the United States with a correlation coefficient (R) of -0.508 and weighted average of 37.4%, a difference of 13.4%.
Associate's Degree Correlation Summary
| Measurement | British West Indian | Cajun |
| Minimum | 18.3% | 5.4% |
| Maximum | 74.7% | 47.6% |
| Range | 56.4% | 42.2% |
| Mean | 41.2% | 26.2% |
| Median | 40.8% | 24.9% |
| Interquartile 25% (IQ1) | 35.3% | 19.5% |
| Interquartile 75% (IQ3) | 46.2% | 32.9% |
| Interquartile Range (IQR) | 10.9% | 13.4% |
| Standard Deviation (Sample) | 9.9% | 8.9% |
| Standard Deviation (Population) | 9.8% | 8.8% |
Similar Demographics by Associate's Degree
Demographics Similar to British West Indians by Associate's Degree
In terms of associate's degree, the demographic groups most similar to British West Indians are Immigrants from West Indies (42.4%, a difference of 0.010%), Guyanese (42.3%, a difference of 0.12%), Immigrants from Liberia (42.3%, a difference of 0.26%), Immigrants from Cambodia (42.3%, a difference of 0.28%), and Delaware (42.3%, a difference of 0.31%).
| Demographics | Rating | Rank | Associate's Degree |
| Tlingit-Haida | 2.1 /100 | #234 | Tragic 43.0% |
| Ecuadorians | 2.0 /100 | #235 | Tragic 43.0% |
| Immigrants | St. Vincent and the Grenadines | 1.9 /100 | #236 | Tragic 42.9% |
| Immigrants | Nonimmigrants | 1.9 /100 | #237 | Tragic 42.9% |
| Iroquois | 1.7 /100 | #238 | Tragic 42.8% |
| Immigrants | Grenada | 1.3 /100 | #239 | Tragic 42.6% |
| Cree | 1.2 /100 | #240 | Tragic 42.5% |
| British West Indians | 1.0 /100 | #241 | Tragic 42.4% |
| Immigrants | West Indies | 1.0 /100 | #242 | Tragic 42.4% |
| Guyanese | 1.0 /100 | #243 | Tragic 42.3% |
| Immigrants | Liberia | 0.9 /100 | #244 | Tragic 42.3% |
| Immigrants | Cambodia | 0.9 /100 | #245 | Tragic 42.3% |
| Delaware | 0.9 /100 | #246 | Tragic 42.3% |
| Immigrants | Fiji | 0.8 /100 | #247 | Tragic 42.2% |
| Immigrants | Ecuador | 0.8 /100 | #248 | Tragic 42.2% |
Demographics Similar to Cajuns by Associate's Degree
In terms of associate's degree, the demographic groups most similar to Cajuns are Fijian (37.4%, a difference of 0.030%), Immigrants from Yemen (37.3%, a difference of 0.12%), Alaska Native (37.5%, a difference of 0.25%), Pennsylvania German (37.2%, a difference of 0.40%), and Yaqui (37.6%, a difference of 0.48%).
| Demographics | Rating | Rank | Associate's Degree |
| Hispanics or Latinos | 0.0 /100 | #313 | Tragic 37.7% |
| Seminole | 0.0 /100 | #314 | Tragic 37.7% |
| Creek | 0.0 /100 | #315 | Tragic 37.6% |
| Crow | 0.0 /100 | #316 | Tragic 37.6% |
| Yaqui | 0.0 /100 | #317 | Tragic 37.6% |
| Alaska Natives | 0.0 /100 | #318 | Tragic 37.5% |
| Fijians | 0.0 /100 | #319 | Tragic 37.4% |
| Cajuns | 0.0 /100 | #320 | Tragic 37.4% |
| Immigrants | Yemen | 0.0 /100 | #321 | Tragic 37.3% |
| Pennsylvania Germans | 0.0 /100 | #322 | Tragic 37.2% |
| Immigrants | Cabo Verde | 0.0 /100 | #323 | Tragic 36.8% |
| Arapaho | 0.0 /100 | #324 | Tragic 36.7% |
| Menominee | 0.0 /100 | #325 | Tragic 36.7% |
| Kiowa | 0.0 /100 | #326 | Tragic 36.5% |
| Dutch West Indians | 0.0 /100 | #327 | Tragic 36.5% |