British West Indian vs Immigrants from Venezuela Associate's Degree
COMPARE
British West Indian
Immigrants from Venezuela
Associate's Degree
Associate's Degree Comparison
British West Indians
Immigrants from Venezuela
42.4%
ASSOCIATE'S DEGREE
1.0/ 100
METRIC RATING
241st/ 347
METRIC RANK
49.1%
ASSOCIATE'S DEGREE
95.8/ 100
METRIC RATING
111th/ 347
METRIC RANK
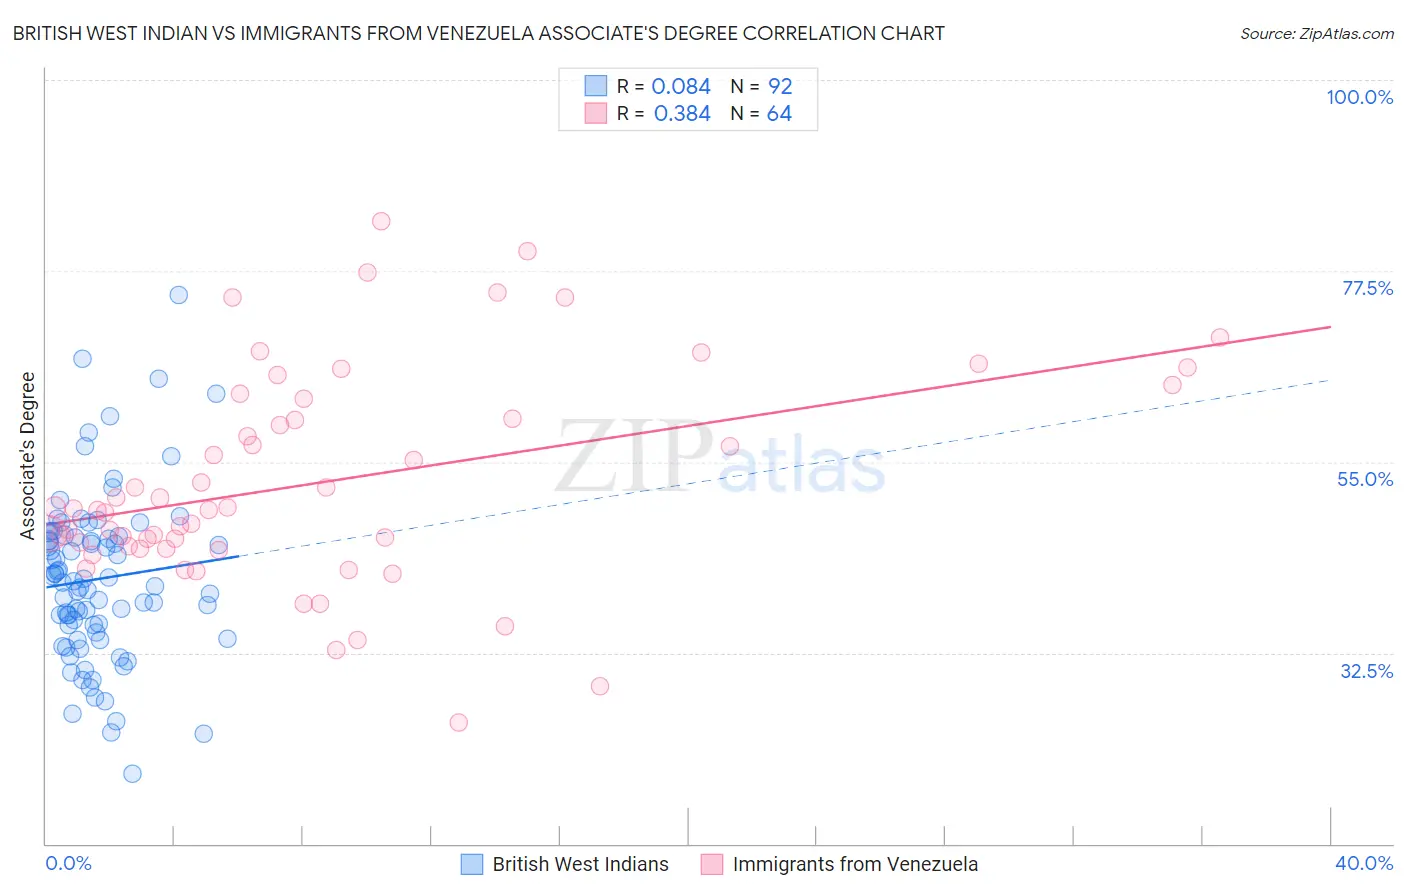
British West Indian vs Immigrants from Venezuela Associate's Degree Correlation Chart
The statistical analysis conducted on geographies consisting of 152,683,655 people shows a slight positive correlation between the proportion of British West Indians and percentage of population with at least associate's degree education in the United States with a correlation coefficient (R) of 0.084 and weighted average of 42.4%. Similarly, the statistical analysis conducted on geographies consisting of 287,855,675 people shows a mild positive correlation between the proportion of Immigrants from Venezuela and percentage of population with at least associate's degree education in the United States with a correlation coefficient (R) of 0.384 and weighted average of 49.1%, a difference of 15.8%.
Associate's Degree Correlation Summary
| Measurement | British West Indian | Immigrants from Venezuela |
| Minimum | 18.3% | 24.3% |
| Maximum | 74.7% | 83.4% |
| Range | 56.4% | 59.1% |
| Mean | 41.2% | 52.6% |
| Median | 40.8% | 49.4% |
| Interquartile 25% (IQ1) | 35.3% | 44.9% |
| Interquartile 75% (IQ3) | 46.2% | 61.3% |
| Interquartile Range (IQR) | 10.9% | 16.4% |
| Standard Deviation (Sample) | 9.9% | 12.6% |
| Standard Deviation (Population) | 9.8% | 12.5% |
Similar Demographics by Associate's Degree
Demographics Similar to British West Indians by Associate's Degree
In terms of associate's degree, the demographic groups most similar to British West Indians are Immigrants from West Indies (42.4%, a difference of 0.010%), Guyanese (42.3%, a difference of 0.12%), Immigrants from Liberia (42.3%, a difference of 0.26%), Immigrants from Cambodia (42.3%, a difference of 0.28%), and Delaware (42.3%, a difference of 0.31%).
| Demographics | Rating | Rank | Associate's Degree |
| Tlingit-Haida | 2.1 /100 | #234 | Tragic 43.0% |
| Ecuadorians | 2.0 /100 | #235 | Tragic 43.0% |
| Immigrants | St. Vincent and the Grenadines | 1.9 /100 | #236 | Tragic 42.9% |
| Immigrants | Nonimmigrants | 1.9 /100 | #237 | Tragic 42.9% |
| Iroquois | 1.7 /100 | #238 | Tragic 42.8% |
| Immigrants | Grenada | 1.3 /100 | #239 | Tragic 42.6% |
| Cree | 1.2 /100 | #240 | Tragic 42.5% |
| British West Indians | 1.0 /100 | #241 | Tragic 42.4% |
| Immigrants | West Indies | 1.0 /100 | #242 | Tragic 42.4% |
| Guyanese | 1.0 /100 | #243 | Tragic 42.3% |
| Immigrants | Liberia | 0.9 /100 | #244 | Tragic 42.3% |
| Immigrants | Cambodia | 0.9 /100 | #245 | Tragic 42.3% |
| Delaware | 0.9 /100 | #246 | Tragic 42.3% |
| Immigrants | Fiji | 0.8 /100 | #247 | Tragic 42.2% |
| Immigrants | Ecuador | 0.8 /100 | #248 | Tragic 42.2% |
Demographics Similar to Immigrants from Venezuela by Associate's Degree
In terms of associate's degree, the demographic groups most similar to Immigrants from Venezuela are Austrian (49.1%, a difference of 0.030%), Immigrants from Chile (49.0%, a difference of 0.19%), Palestinian (49.0%, a difference of 0.19%), Arab (49.0%, a difference of 0.19%), and Immigrants from Morocco (49.2%, a difference of 0.26%).
| Demographics | Rating | Rank | Associate's Degree |
| Venezuelans | 97.0 /100 | #104 | Exceptional 49.4% |
| Croatians | 96.8 /100 | #105 | Exceptional 49.3% |
| Immigrants | Italy | 96.7 /100 | #106 | Exceptional 49.3% |
| Syrians | 96.7 /100 | #107 | Exceptional 49.3% |
| Jordanians | 96.6 /100 | #108 | Exceptional 49.2% |
| Immigrants | Morocco | 96.3 /100 | #109 | Exceptional 49.2% |
| Austrians | 95.8 /100 | #110 | Exceptional 49.1% |
| Immigrants | Venezuela | 95.8 /100 | #111 | Exceptional 49.1% |
| Immigrants | Chile | 95.3 /100 | #112 | Exceptional 49.0% |
| Palestinians | 95.3 /100 | #113 | Exceptional 49.0% |
| Arabs | 95.3 /100 | #114 | Exceptional 49.0% |
| Luxembourgers | 95.1 /100 | #115 | Exceptional 48.9% |
| British | 95.0 /100 | #116 | Exceptional 48.9% |
| Afghans | 94.8 /100 | #117 | Exceptional 48.9% |
| Albanians | 94.7 /100 | #118 | Exceptional 48.8% |