British West Indian vs Immigrants from Vietnam In Labor Force | Age 20-64
COMPARE
British West Indian
Immigrants from Vietnam
In Labor Force | Age 20-64
In Labor Force | Age 20-64 Comparison
British West Indians
Immigrants from Vietnam
78.4%
IN LABOR FORCE | AGE 20-64
0.1/ 100
METRIC RATING
265th/ 347
METRIC RANK
80.0%
IN LABOR FORCE | AGE 20-64
92.7/ 100
METRIC RATING
117th/ 347
METRIC RANK
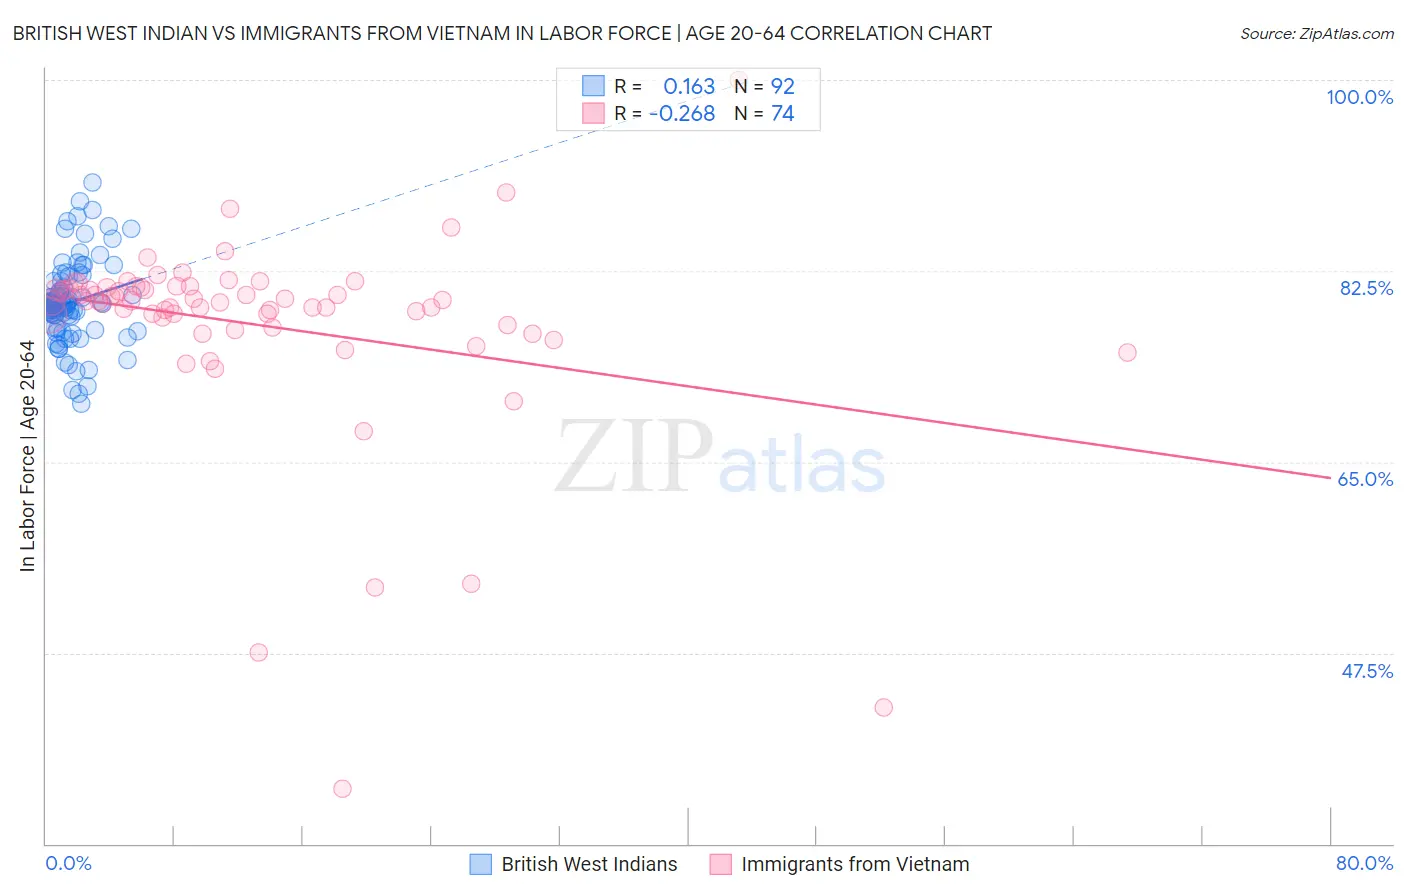
British West Indian vs Immigrants from Vietnam In Labor Force | Age 20-64 Correlation Chart
The statistical analysis conducted on geographies consisting of 152,617,449 people shows a poor positive correlation between the proportion of British West Indians and labor force participation rate among population between the ages 20 and 64 in the United States with a correlation coefficient (R) of 0.163 and weighted average of 78.4%. Similarly, the statistical analysis conducted on geographies consisting of 404,837,038 people shows a weak negative correlation between the proportion of Immigrants from Vietnam and labor force participation rate among population between the ages 20 and 64 in the United States with a correlation coefficient (R) of -0.268 and weighted average of 80.0%, a difference of 2.0%.
In Labor Force | Age 20-64 Correlation Summary
| Measurement | British West Indian | Immigrants from Vietnam |
| Minimum | 70.3% | 35.0% |
| Maximum | 90.6% | 100.0% |
| Range | 20.3% | 65.0% |
| Mean | 79.6% | 77.6% |
| Median | 79.4% | 79.7% |
| Interquartile 25% (IQ1) | 77.2% | 77.6% |
| Interquartile 75% (IQ3) | 81.5% | 81.0% |
| Interquartile Range (IQR) | 4.3% | 3.4% |
| Standard Deviation (Sample) | 3.9% | 9.5% |
| Standard Deviation (Population) | 3.9% | 9.4% |
Similar Demographics by In Labor Force | Age 20-64
Demographics Similar to British West Indians by In Labor Force | Age 20-64
In terms of in labor force | age 20-64, the demographic groups most similar to British West Indians are Bahamian (78.4%, a difference of 0.010%), U.S. Virgin Islander (78.4%, a difference of 0.030%), Spaniard (78.4%, a difference of 0.040%), Pennsylvania German (78.4%, a difference of 0.050%), and West Indian (78.3%, a difference of 0.050%).
| Demographics | Rating | Rank | In Labor Force | Age 20-64 |
| Immigrants | Guatemala | 0.4 /100 | #258 | Tragic 78.7% |
| Tsimshian | 0.4 /100 | #259 | Tragic 78.7% |
| Immigrants | Fiji | 0.3 /100 | #260 | Tragic 78.6% |
| Whites/Caucasians | 0.2 /100 | #261 | Tragic 78.5% |
| Fijians | 0.1 /100 | #262 | Tragic 78.4% |
| Pennsylvania Germans | 0.1 /100 | #263 | Tragic 78.4% |
| Spaniards | 0.1 /100 | #264 | Tragic 78.4% |
| British West Indians | 0.1 /100 | #265 | Tragic 78.4% |
| Bahamians | 0.1 /100 | #266 | Tragic 78.4% |
| U.S. Virgin Islanders | 0.1 /100 | #267 | Tragic 78.4% |
| West Indians | 0.0 /100 | #268 | Tragic 78.3% |
| Immigrants | Barbados | 0.0 /100 | #269 | Tragic 78.3% |
| Scotch-Irish | 0.0 /100 | #270 | Tragic 78.3% |
| Immigrants | Latin America | 0.0 /100 | #271 | Tragic 78.3% |
| Marshallese | 0.0 /100 | #272 | Tragic 78.3% |
Demographics Similar to Immigrants from Vietnam by In Labor Force | Age 20-64
In terms of in labor force | age 20-64, the demographic groups most similar to Immigrants from Vietnam are Cape Verdean (80.0%, a difference of 0.0%), Immigrants from Western Africa (80.0%, a difference of 0.010%), Immigrants from Taiwan (80.0%, a difference of 0.010%), Maltese (80.0%, a difference of 0.010%), and Immigrants from Kuwait (80.0%, a difference of 0.010%).
| Demographics | Rating | Rank | In Labor Force | Age 20-64 |
| Estonians | 94.0 /100 | #110 | Exceptional 80.0% |
| Immigrants | South America | 93.9 /100 | #111 | Exceptional 80.0% |
| Immigrants | Italy | 93.9 /100 | #112 | Exceptional 80.0% |
| Sri Lankans | 93.9 /100 | #113 | Exceptional 80.0% |
| Argentineans | 93.8 /100 | #114 | Exceptional 80.0% |
| Bermudans | 93.3 /100 | #115 | Exceptional 80.0% |
| Immigrants | Western Africa | 93.1 /100 | #116 | Exceptional 80.0% |
| Immigrants | Vietnam | 92.7 /100 | #117 | Exceptional 80.0% |
| Cape Verdeans | 92.7 /100 | #118 | Exceptional 80.0% |
| Immigrants | Taiwan | 92.5 /100 | #119 | Exceptional 80.0% |
| Maltese | 92.4 /100 | #120 | Exceptional 80.0% |
| Immigrants | Kuwait | 92.2 /100 | #121 | Exceptional 80.0% |
| Mongolians | 92.0 /100 | #122 | Exceptional 79.9% |
| Immigrants | Russia | 91.8 /100 | #123 | Exceptional 79.9% |
| Immigrants | Europe | 91.6 /100 | #124 | Exceptional 79.9% |