British vs Cambodian No Schooling Completed
COMPARE
British
Cambodian
No Schooling Completed
No Schooling Completed Comparison
British
Cambodians
1.5%
NO SCHOOLING COMPLETED
100.0/ 100
METRIC RATING
30th/ 347
METRIC RANK
1.9%
NO SCHOOLING COMPLETED
93.8/ 100
METRIC RATING
124th/ 347
METRIC RANK
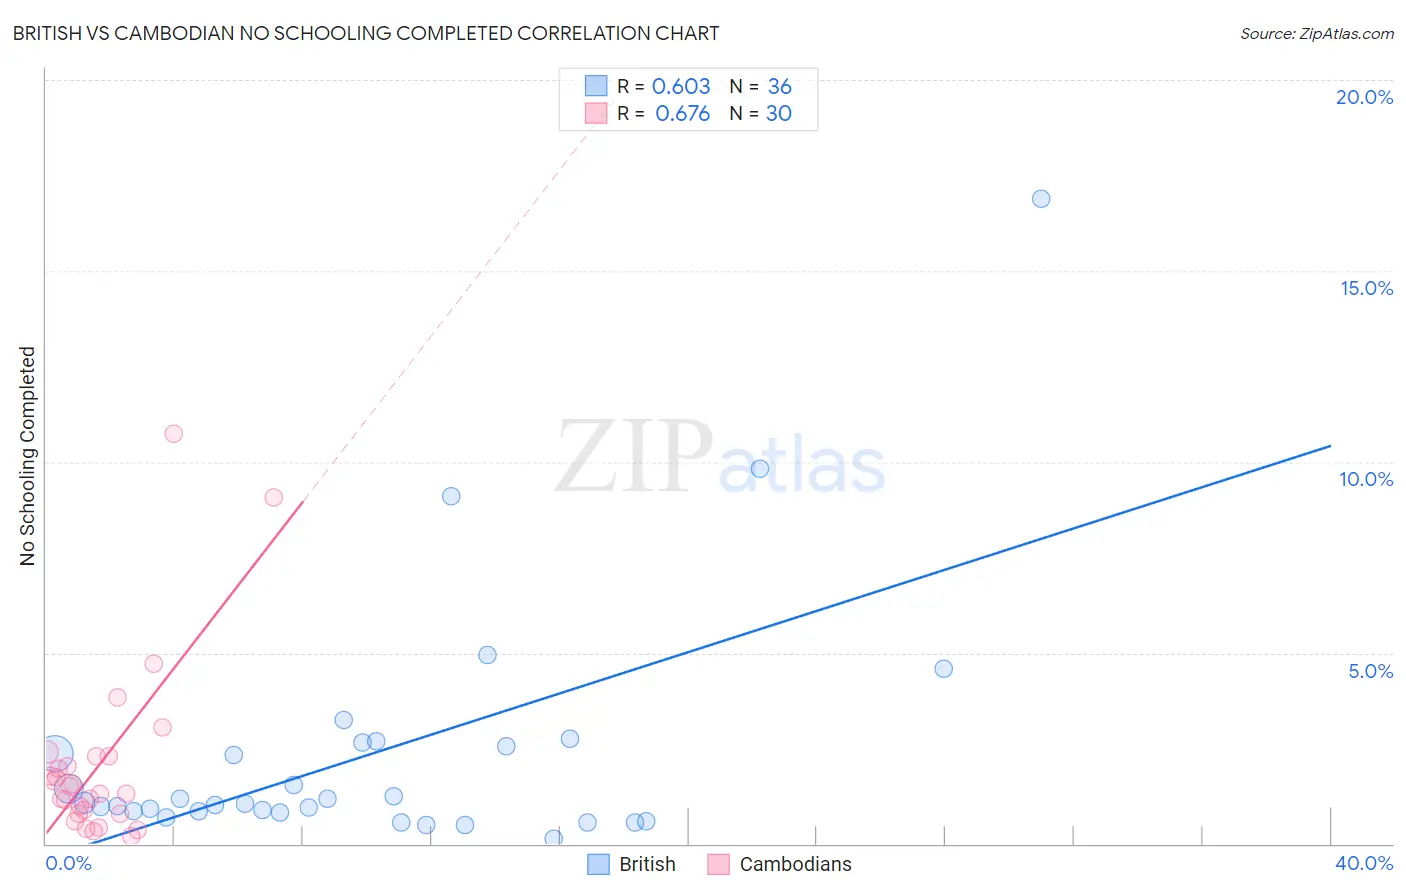
British vs Cambodian No Schooling Completed Correlation Chart
The statistical analysis conducted on geographies consisting of 518,649,413 people shows a significant positive correlation between the proportion of British and percentage of population with no schooling in the United States with a correlation coefficient (R) of 0.603 and weighted average of 1.5%. Similarly, the statistical analysis conducted on geographies consisting of 102,234,133 people shows a significant positive correlation between the proportion of Cambodians and percentage of population with no schooling in the United States with a correlation coefficient (R) of 0.676 and weighted average of 1.9%, a difference of 24.9%.
No Schooling Completed Correlation Summary
| Measurement | British | Cambodian |
| Minimum | 0.14% | 0.20% |
| Maximum | 16.9% | 10.7% |
| Range | 16.8% | 10.5% |
| Mean | 2.4% | 2.1% |
| Median | 1.1% | 1.4% |
| Interquartile 25% (IQ1) | 0.83% | 0.79% |
| Interquartile 75% (IQ3) | 2.6% | 2.3% |
| Interquartile Range (IQR) | 1.8% | 1.5% |
| Standard Deviation (Sample) | 3.3% | 2.4% |
| Standard Deviation (Population) | 3.3% | 2.3% |
Similar Demographics by No Schooling Completed
Demographics Similar to British by No Schooling Completed
In terms of no schooling completed, the demographic groups most similar to British are Inupiat (1.5%, a difference of 0.030%), Swiss (1.5%, a difference of 0.42%), Lumbee (1.5%, a difference of 0.48%), Italian (1.5%, a difference of 1.1%), and Latvian (1.5%, a difference of 1.4%).
| Demographics | Rating | Rank | No Schooling Completed |
| Europeans | 100.0 /100 | #23 | Exceptional 1.5% |
| Pennsylvania Germans | 100.0 /100 | #24 | Exceptional 1.5% |
| French | 100.0 /100 | #25 | Exceptional 1.5% |
| Czechs | 100.0 /100 | #26 | Exceptional 1.5% |
| Scandinavians | 100.0 /100 | #27 | Exceptional 1.5% |
| French Canadians | 100.0 /100 | #28 | Exceptional 1.5% |
| Lumbee | 100.0 /100 | #29 | Exceptional 1.5% |
| British | 100.0 /100 | #30 | Exceptional 1.5% |
| Inupiat | 100.0 /100 | #31 | Exceptional 1.5% |
| Swiss | 100.0 /100 | #32 | Exceptional 1.5% |
| Italians | 100.0 /100 | #33 | Exceptional 1.5% |
| Latvians | 100.0 /100 | #34 | Exceptional 1.5% |
| Eastern Europeans | 100.0 /100 | #35 | Exceptional 1.6% |
| Aleuts | 99.9 /100 | #36 | Exceptional 1.6% |
| Belgians | 99.9 /100 | #37 | Exceptional 1.6% |
Demographics Similar to Cambodians by No Schooling Completed
In terms of no schooling completed, the demographic groups most similar to Cambodians are Immigrants from Kuwait (1.9%, a difference of 0.080%), Immigrants from Europe (1.9%, a difference of 0.090%), Cree (1.9%, a difference of 0.44%), Immigrants from Croatia (1.9%, a difference of 0.47%), and Immigrants from Bulgaria (1.9%, a difference of 0.53%).
| Demographics | Rating | Rank | No Schooling Completed |
| Immigrants | Serbia | 95.8 /100 | #117 | Exceptional 1.9% |
| Spanish | 95.5 /100 | #118 | Exceptional 1.9% |
| Iroquois | 95.1 /100 | #119 | Exceptional 1.9% |
| Immigrants | Bulgaria | 94.6 /100 | #120 | Exceptional 1.9% |
| Immigrants | Croatia | 94.5 /100 | #121 | Exceptional 1.9% |
| Cree | 94.5 /100 | #122 | Exceptional 1.9% |
| Immigrants | Kuwait | 93.9 /100 | #123 | Exceptional 1.9% |
| Cambodians | 93.8 /100 | #124 | Exceptional 1.9% |
| Immigrants | Europe | 93.7 /100 | #125 | Exceptional 1.9% |
| Immigrants | Romania | 92.6 /100 | #126 | Exceptional 1.9% |
| Israelis | 92.4 /100 | #127 | Exceptional 1.9% |
| Spaniards | 92.3 /100 | #128 | Exceptional 1.9% |
| Seminole | 92.0 /100 | #129 | Exceptional 1.9% |
| Palestinians | 91.8 /100 | #130 | Exceptional 1.9% |
| Immigrants | Hungary | 91.6 /100 | #131 | Exceptional 1.9% |