Sierra Leonean vs Immigrants from Portugal Doctorate Degree
COMPARE
Sierra Leonean
Immigrants from Portugal
Doctorate Degree
Doctorate Degree Comparison
Sierra Leoneans
Immigrants from Portugal
2.0%
DOCTORATE DEGREE
85.1/ 100
METRIC RATING
143rd/ 347
METRIC RANK
1.5%
DOCTORATE DEGREE
0.8/ 100
METRIC RATING
261st/ 347
METRIC RANK
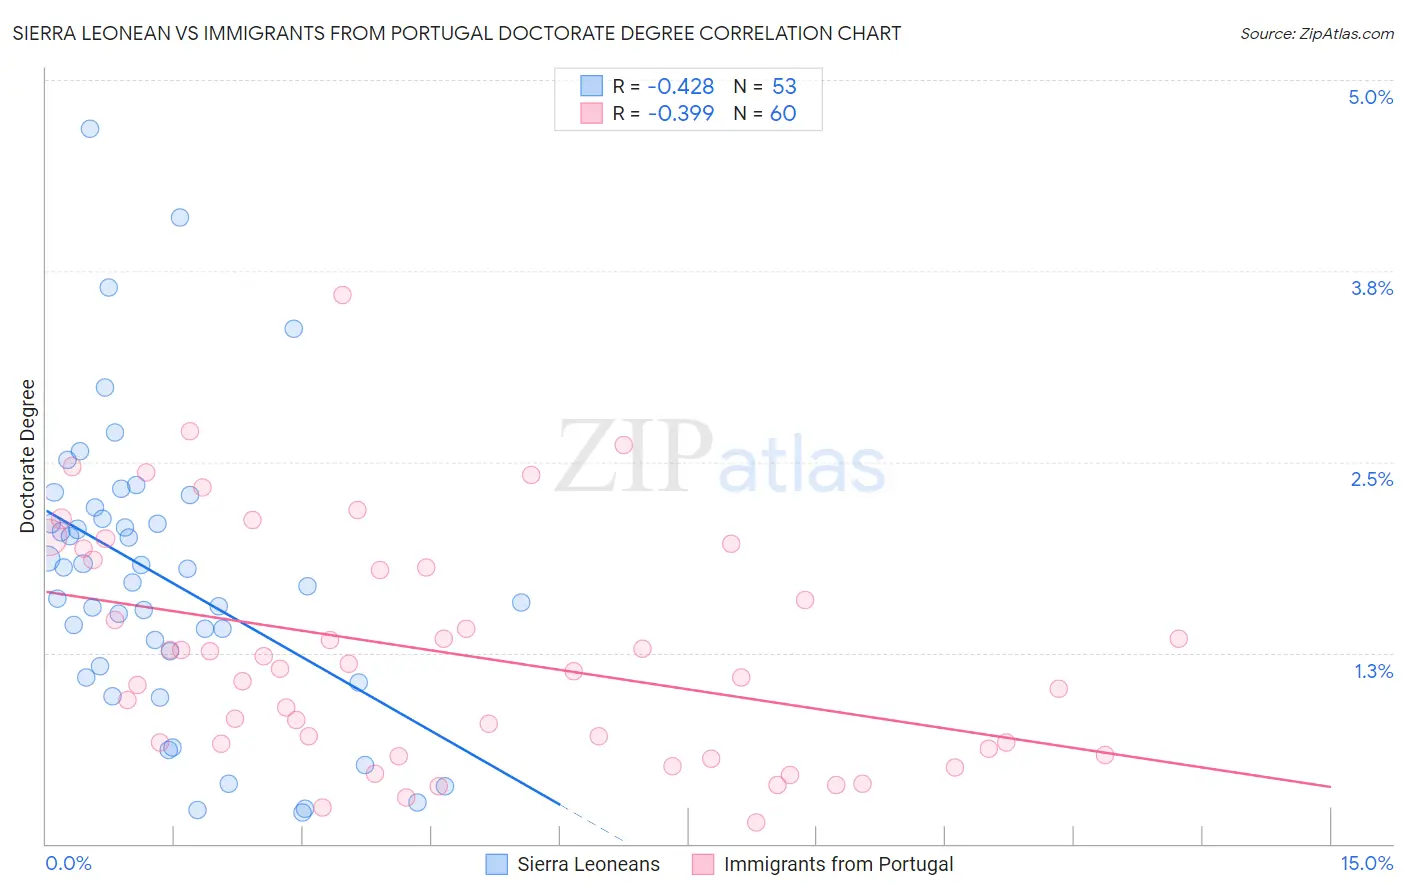
Sierra Leonean vs Immigrants from Portugal Doctorate Degree Correlation Chart
The statistical analysis conducted on geographies consisting of 83,237,718 people shows a moderate negative correlation between the proportion of Sierra Leoneans and percentage of population with at least doctorate degree education in the United States with a correlation coefficient (R) of -0.428 and weighted average of 2.0%. Similarly, the statistical analysis conducted on geographies consisting of 173,995,851 people shows a mild negative correlation between the proportion of Immigrants from Portugal and percentage of population with at least doctorate degree education in the United States with a correlation coefficient (R) of -0.399 and weighted average of 1.5%, a difference of 29.4%.
Doctorate Degree Correlation Summary
| Measurement | Sierra Leonean | Immigrants from Portugal |
| Minimum | 0.21% | 0.14% |
| Maximum | 4.7% | 3.6% |
| Range | 4.5% | 3.5% |
| Mean | 1.7% | 1.2% |
| Median | 1.7% | 1.1% |
| Interquartile 25% (IQ1) | 1.1% | 0.64% |
| Interquartile 75% (IQ3) | 2.2% | 1.8% |
| Interquartile Range (IQR) | 1.0% | 1.2% |
| Standard Deviation (Sample) | 0.95% | 0.75% |
| Standard Deviation (Population) | 0.94% | 0.75% |
Similar Demographics by Doctorate Degree
Demographics Similar to Sierra Leoneans by Doctorate Degree
In terms of doctorate degree, the demographic groups most similar to Sierra Leoneans are Immigrants from Moldova (2.0%, a difference of 0.21%), Italian (2.0%, a difference of 0.25%), Kenyan (1.9%, a difference of 0.39%), Immigrants from Syria (1.9%, a difference of 0.41%), and Senegalese (2.0%, a difference of 0.46%).
| Demographics | Rating | Rank | Doctorate Degree |
| Swedes | 88.3 /100 | #136 | Excellent 2.0% |
| South American Indians | 88.3 /100 | #137 | Excellent 2.0% |
| Swiss | 88.0 /100 | #138 | Excellent 2.0% |
| Afghans | 87.2 /100 | #139 | Excellent 2.0% |
| Immigrants | Africa | 87.0 /100 | #140 | Excellent 2.0% |
| Senegalese | 86.7 /100 | #141 | Excellent 2.0% |
| Italians | 86.0 /100 | #142 | Excellent 2.0% |
| Sierra Leoneans | 85.1 /100 | #143 | Excellent 2.0% |
| Immigrants | Moldova | 84.3 /100 | #144 | Excellent 2.0% |
| Kenyans | 83.6 /100 | #145 | Excellent 1.9% |
| Immigrants | Syria | 83.6 /100 | #146 | Excellent 1.9% |
| Immigrants | Senegal | 82.5 /100 | #147 | Excellent 1.9% |
| Luxembourgers | 81.1 /100 | #148 | Excellent 1.9% |
| Basques | 76.9 /100 | #149 | Good 1.9% |
| English | 75.9 /100 | #150 | Good 1.9% |
Demographics Similar to Immigrants from Portugal by Doctorate Degree
In terms of doctorate degree, the demographic groups most similar to Immigrants from Portugal are Chickasaw (1.5%, a difference of 0.15%), Immigrants from Bahamas (1.5%, a difference of 0.32%), Japanese (1.5%, a difference of 0.46%), Blackfeet (1.5%, a difference of 0.51%), and Liberian (1.5%, a difference of 0.56%).
| Demographics | Rating | Rank | Doctorate Degree |
| Immigrants | Cambodia | 1.0 /100 | #254 | Tragic 1.5% |
| Trinidadians and Tobagonians | 1.0 /100 | #255 | Tragic 1.5% |
| Central American Indians | 1.0 /100 | #256 | Tragic 1.5% |
| Chippewa | 0.9 /100 | #257 | Tragic 1.5% |
| Immigrants | West Indies | 0.9 /100 | #258 | Tragic 1.5% |
| Liberians | 0.9 /100 | #259 | Tragic 1.5% |
| Japanese | 0.9 /100 | #260 | Tragic 1.5% |
| Immigrants | Portugal | 0.8 /100 | #261 | Tragic 1.5% |
| Chickasaw | 0.7 /100 | #262 | Tragic 1.5% |
| Immigrants | Bahamas | 0.7 /100 | #263 | Tragic 1.5% |
| Blackfeet | 0.7 /100 | #264 | Tragic 1.5% |
| Nicaraguans | 0.6 /100 | #265 | Tragic 1.5% |
| Immigrants | Liberia | 0.5 /100 | #266 | Tragic 1.5% |
| Kiowa | 0.5 /100 | #267 | Tragic 1.5% |
| U.S. Virgin Islanders | 0.5 /100 | #268 | Tragic 1.5% |