Bolivian vs Immigrants from Zimbabwe Hearing Disability
COMPARE
Bolivian
Immigrants from Zimbabwe
Hearing Disability
Hearing Disability Comparison
Bolivians
Immigrants from Zimbabwe
2.6%
HEARING DISABILITY
99.7/ 100
METRIC RATING
29th/ 347
METRIC RANK
3.0%
HEARING DISABILITY
64.2/ 100
METRIC RATING
165th/ 347
METRIC RANK
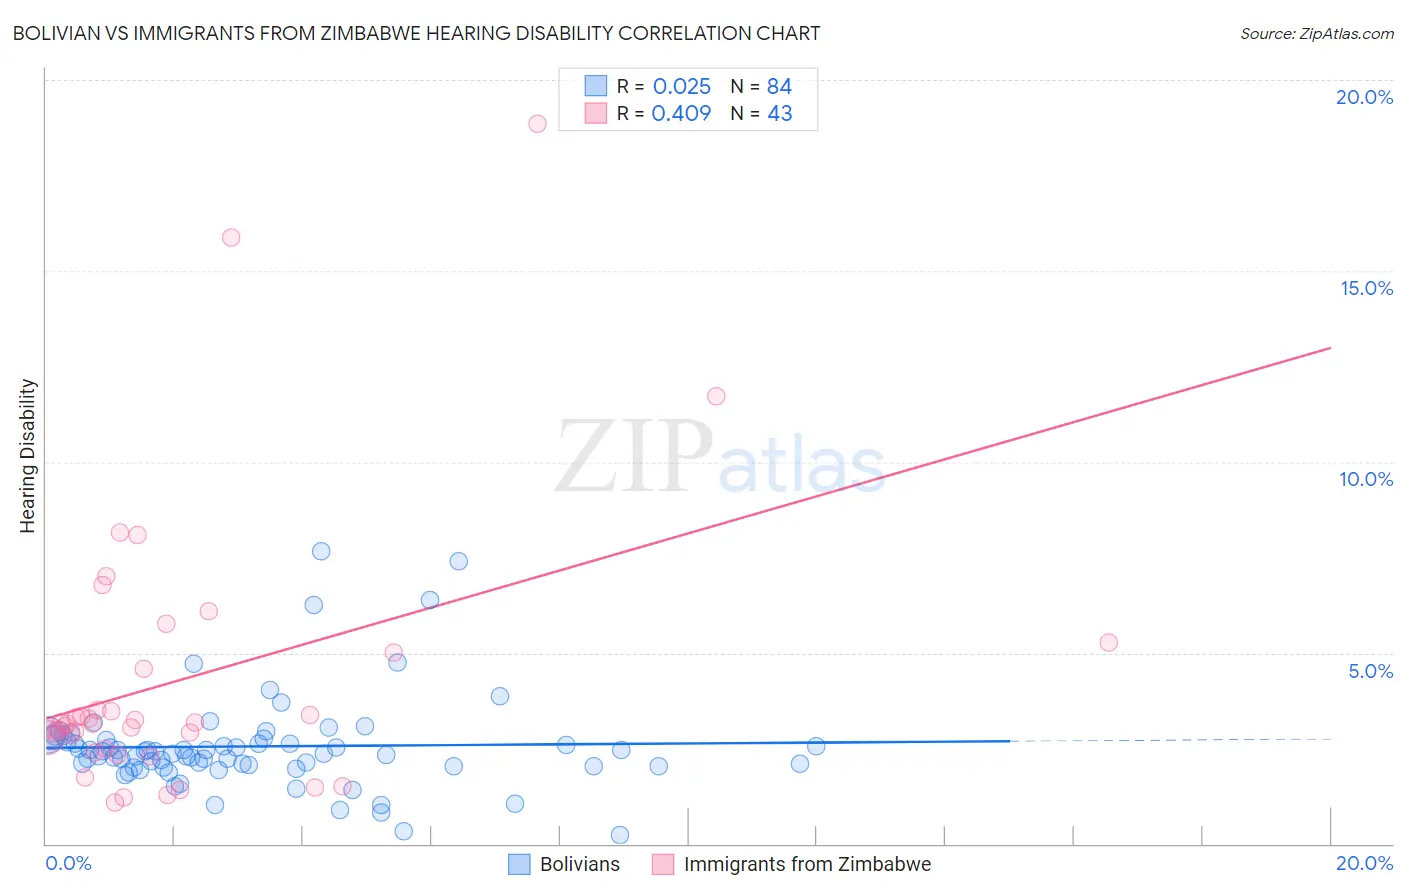
Bolivian vs Immigrants from Zimbabwe Hearing Disability Correlation Chart
The statistical analysis conducted on geographies consisting of 184,637,856 people shows no correlation between the proportion of Bolivians and percentage of population with hearing disability in the United States with a correlation coefficient (R) of 0.025 and weighted average of 2.6%. Similarly, the statistical analysis conducted on geographies consisting of 117,807,709 people shows a moderate positive correlation between the proportion of Immigrants from Zimbabwe and percentage of population with hearing disability in the United States with a correlation coefficient (R) of 0.409 and weighted average of 3.0%, a difference of 14.0%.
Hearing Disability Correlation Summary
| Measurement | Bolivian | Immigrants from Zimbabwe |
| Minimum | 0.24% | 1.1% |
| Maximum | 7.7% | 18.9% |
| Range | 7.4% | 17.8% |
| Mean | 2.5% | 4.3% |
| Median | 2.4% | 3.2% |
| Interquartile 25% (IQ1) | 2.0% | 2.5% |
| Interquartile 75% (IQ3) | 2.7% | 5.0% |
| Interquartile Range (IQR) | 0.70% | 2.5% |
| Standard Deviation (Sample) | 1.2% | 3.6% |
| Standard Deviation (Population) | 1.2% | 3.6% |
Similar Demographics by Hearing Disability
Demographics Similar to Bolivians by Hearing Disability
In terms of hearing disability, the demographic groups most similar to Bolivians are Immigrants from Haiti (2.6%, a difference of 0.020%), Immigrants from Caribbean (2.6%, a difference of 0.080%), Immigrants from Cameroon (2.6%, a difference of 0.090%), Immigrants from Venezuela (2.6%, a difference of 0.23%), and Immigrants from South Central Asia (2.6%, a difference of 0.40%).
| Demographics | Rating | Rank | Hearing Disability |
| Immigrants | Sierra Leone | 99.8 /100 | #22 | Exceptional 2.6% |
| Immigrants | Nigeria | 99.8 /100 | #23 | Exceptional 2.6% |
| Immigrants | Ghana | 99.8 /100 | #24 | Exceptional 2.6% |
| Immigrants | El Salvador | 99.7 /100 | #25 | Exceptional 2.6% |
| Immigrants | Senegal | 99.7 /100 | #26 | Exceptional 2.6% |
| Immigrants | South Central Asia | 99.7 /100 | #27 | Exceptional 2.6% |
| Immigrants | Haiti | 99.7 /100 | #28 | Exceptional 2.6% |
| Bolivians | 99.7 /100 | #29 | Exceptional 2.6% |
| Immigrants | Caribbean | 99.7 /100 | #30 | Exceptional 2.6% |
| Immigrants | Cameroon | 99.7 /100 | #31 | Exceptional 2.6% |
| Immigrants | Venezuela | 99.7 /100 | #32 | Exceptional 2.6% |
| Filipinos | 99.6 /100 | #33 | Exceptional 2.6% |
| Immigrants | Pakistan | 99.6 /100 | #34 | Exceptional 2.6% |
| Salvadorans | 99.6 /100 | #35 | Exceptional 2.6% |
| Okinawans | 99.6 /100 | #36 | Exceptional 2.6% |
Demographics Similar to Immigrants from Zimbabwe by Hearing Disability
In terms of hearing disability, the demographic groups most similar to Immigrants from Zimbabwe are Immigrants from Cambodia (3.0%, a difference of 0.060%), Immigrants from Central America (3.0%, a difference of 0.080%), Immigrants from South Eastern Asia (3.0%, a difference of 0.14%), Immigrants from Japan (2.9%, a difference of 0.22%), and Albanian (2.9%, a difference of 0.25%).
| Demographics | Rating | Rank | Hearing Disability |
| Immigrants | Burma/Myanmar | 69.5 /100 | #158 | Good 2.9% |
| Immigrants | Australia | 67.4 /100 | #159 | Good 2.9% |
| Immigrants | Fiji | 67.1 /100 | #160 | Good 2.9% |
| Albanians | 66.6 /100 | #161 | Good 2.9% |
| Immigrants | Japan | 66.3 /100 | #162 | Good 2.9% |
| Immigrants | Central America | 64.9 /100 | #163 | Good 3.0% |
| Immigrants | Cambodia | 64.8 /100 | #164 | Good 3.0% |
| Immigrants | Zimbabwe | 64.2 /100 | #165 | Good 3.0% |
| Immigrants | South Eastern Asia | 62.9 /100 | #166 | Good 3.0% |
| Immigrants | Eastern Europe | 58.1 /100 | #167 | Average 3.0% |
| Immigrants | Greece | 57.9 /100 | #168 | Average 3.0% |
| Arabs | 57.6 /100 | #169 | Average 3.0% |
| Immigrants | Cabo Verde | 56.9 /100 | #170 | Average 3.0% |
| Immigrants | Ukraine | 56.6 /100 | #171 | Average 3.0% |
| Armenians | 56.0 /100 | #172 | Average 3.0% |