Brazilian vs Australian College, Under 1 year
COMPARE
Brazilian
Australian
College, Under 1 year
College, Under 1 year Comparison
Brazilians
Australians
65.9%
COLLEGE, UNDER 1 YEAR
66.0/ 100
METRIC RATING
161st/ 347
METRIC RANK
70.4%
COLLEGE, UNDER 1 YEAR
99.9/ 100
METRIC RATING
38th/ 347
METRIC RANK
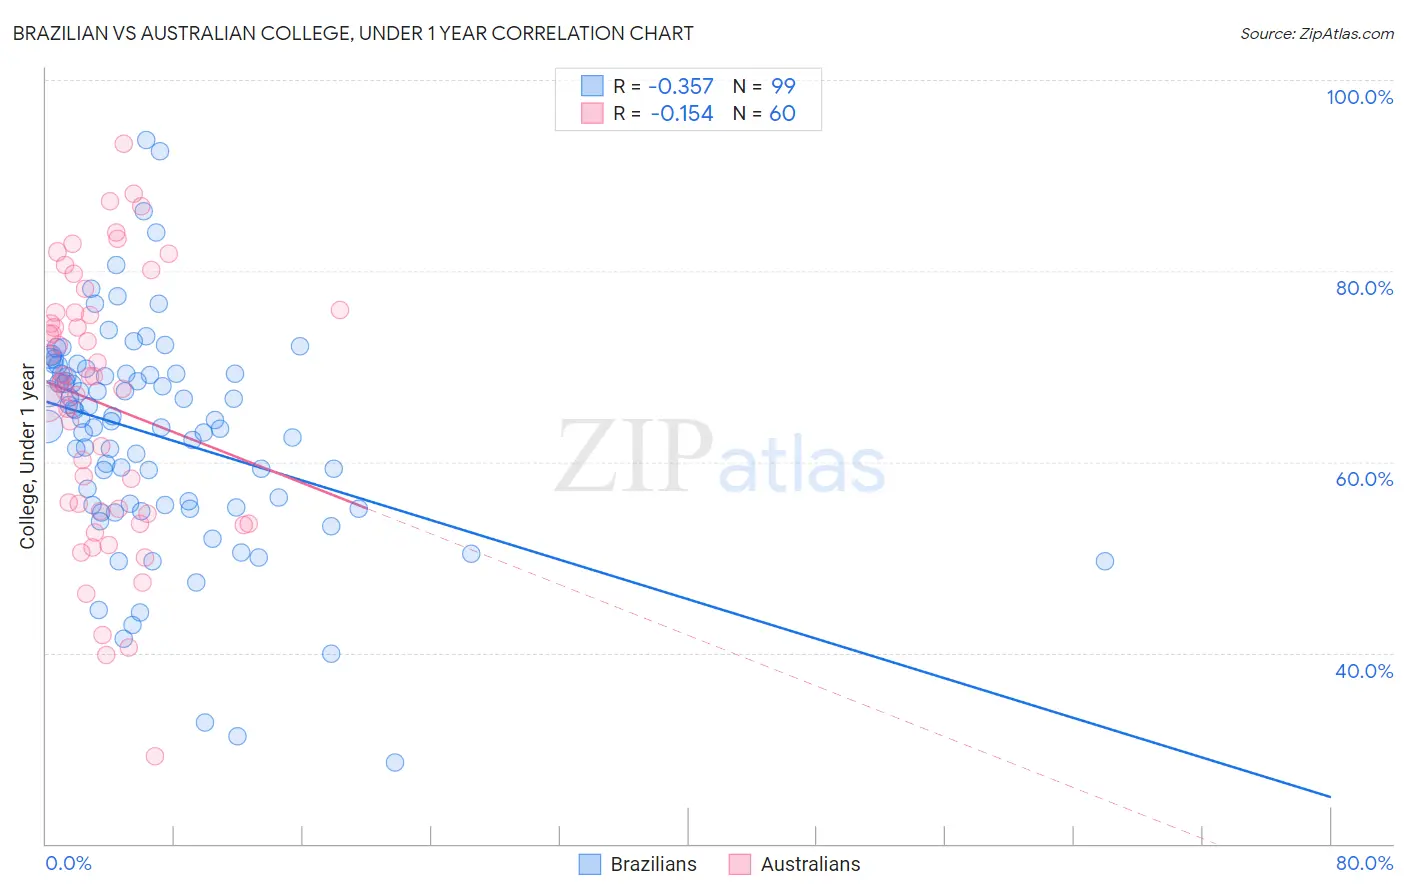
Brazilian vs Australian College, Under 1 year Correlation Chart
The statistical analysis conducted on geographies consisting of 323,962,626 people shows a mild negative correlation between the proportion of Brazilians and percentage of population with at least college, under 1 year education in the United States with a correlation coefficient (R) of -0.357 and weighted average of 65.9%. Similarly, the statistical analysis conducted on geographies consisting of 224,162,526 people shows a poor negative correlation between the proportion of Australians and percentage of population with at least college, under 1 year education in the United States with a correlation coefficient (R) of -0.154 and weighted average of 70.4%, a difference of 6.8%.
College, Under 1 year Correlation Summary
| Measurement | Brazilian | Australian |
| Minimum | 28.5% | 29.1% |
| Maximum | 93.7% | 93.4% |
| Range | 65.2% | 64.2% |
| Mean | 62.8% | 66.0% |
| Median | 64.4% | 68.3% |
| Interquartile 25% (IQ1) | 55.5% | 54.7% |
| Interquartile 75% (IQ3) | 69.3% | 75.6% |
| Interquartile Range (IQR) | 13.8% | 21.0% |
| Standard Deviation (Sample) | 11.6% | 14.0% |
| Standard Deviation (Population) | 11.5% | 13.8% |
Similar Demographics by College, Under 1 year
Demographics Similar to Brazilians by College, Under 1 year
In terms of college, under 1 year, the demographic groups most similar to Brazilians are Albanian (65.9%, a difference of 0.010%), Tlingit-Haida (65.9%, a difference of 0.020%), Korean (65.9%, a difference of 0.030%), Celtic (65.9%, a difference of 0.070%), and Sierra Leonean (66.0%, a difference of 0.090%).
| Demographics | Rating | Rank | College, Under 1 year |
| Immigrants | Eritrea | 71.9 /100 | #154 | Good 66.1% |
| Irish | 70.3 /100 | #155 | Good 66.0% |
| Welsh | 69.9 /100 | #156 | Good 66.0% |
| Sierra Leoneans | 67.8 /100 | #157 | Good 66.0% |
| Celtics | 67.3 /100 | #158 | Good 65.9% |
| Tlingit-Haida | 66.4 /100 | #159 | Good 65.9% |
| Albanians | 66.1 /100 | #160 | Good 65.9% |
| Brazilians | 66.0 /100 | #161 | Good 65.9% |
| Koreans | 65.3 /100 | #162 | Good 65.9% |
| Somalis | 62.7 /100 | #163 | Good 65.8% |
| Czechoslovakians | 62.6 /100 | #164 | Good 65.8% |
| Immigrants | Uzbekistan | 61.6 /100 | #165 | Good 65.8% |
| Moroccans | 56.7 /100 | #166 | Average 65.6% |
| Immigrants | Somalia | 56.4 /100 | #167 | Average 65.6% |
| Hungarians | 55.9 /100 | #168 | Average 65.6% |
Demographics Similar to Australians by College, Under 1 year
In terms of college, under 1 year, the demographic groups most similar to Australians are Bhutanese (70.3%, a difference of 0.020%), Immigrants from Turkey (70.3%, a difference of 0.030%), Immigrants from Saudi Arabia (70.4%, a difference of 0.070%), Immigrants from Kuwait (70.3%, a difference of 0.070%), and Immigrants from Lithuania (70.3%, a difference of 0.11%).
| Demographics | Rating | Rank | College, Under 1 year |
| Indians (Asian) | 99.9 /100 | #31 | Exceptional 70.8% |
| Turks | 99.9 /100 | #32 | Exceptional 70.7% |
| Immigrants | South Africa | 99.9 /100 | #33 | Exceptional 70.6% |
| Estonians | 99.9 /100 | #34 | Exceptional 70.6% |
| Russians | 99.9 /100 | #35 | Exceptional 70.5% |
| Immigrants | Sri Lanka | 99.9 /100 | #36 | Exceptional 70.5% |
| Immigrants | Saudi Arabia | 99.9 /100 | #37 | Exceptional 70.4% |
| Australians | 99.9 /100 | #38 | Exceptional 70.4% |
| Bhutanese | 99.9 /100 | #39 | Exceptional 70.3% |
| Immigrants | Turkey | 99.9 /100 | #40 | Exceptional 70.3% |
| Immigrants | Kuwait | 99.9 /100 | #41 | Exceptional 70.3% |
| Immigrants | Lithuania | 99.9 /100 | #42 | Exceptional 70.3% |
| Israelis | 99.9 /100 | #43 | Exceptional 70.2% |
| New Zealanders | 99.9 /100 | #44 | Exceptional 70.2% |
| Immigrants | Norway | 99.9 /100 | #45 | Exceptional 70.2% |