Bolivian vs Australian Unemployment Among Women with Children Under 6 years
COMPARE
Bolivian
Australian
Unemployment Among Women with Children Under 6 years
Unemployment Among Women with Children Under 6 years Comparison
Bolivians
Australians
7.5%
UNEMPLOYMENT AMONG WOMEN WITH CHILDREN UNDER 6 YEARS
70.8/ 100
METRIC RATING
160th/ 347
METRIC RANK
7.2%
UNEMPLOYMENT AMONG WOMEN WITH CHILDREN UNDER 6 YEARS
96.9/ 100
METRIC RATING
109th/ 347
METRIC RANK
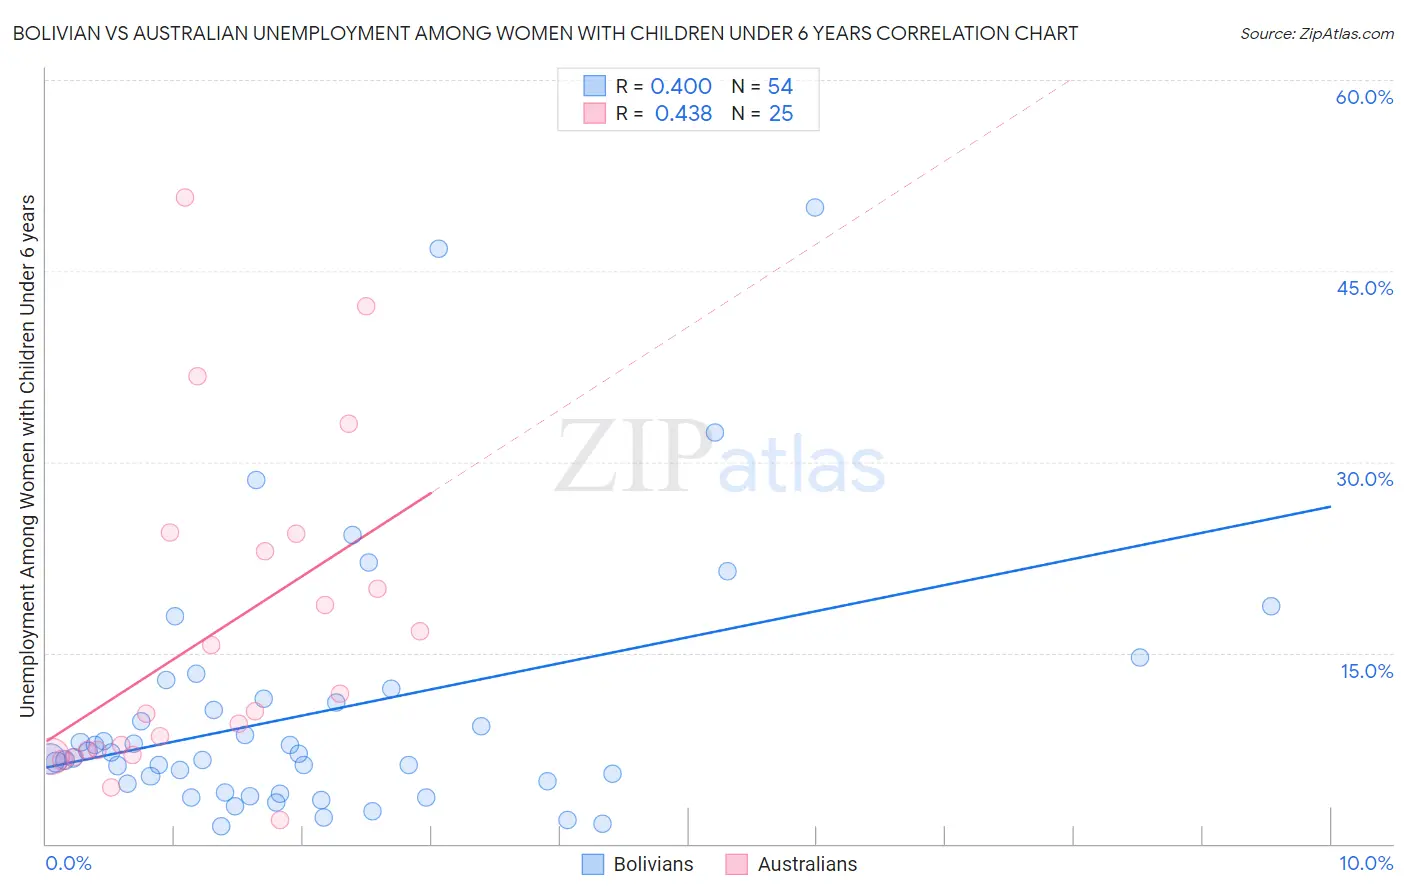
Bolivian vs Australian Unemployment Among Women with Children Under 6 years Correlation Chart
The statistical analysis conducted on geographies consisting of 159,245,039 people shows a mild positive correlation between the proportion of Bolivians and unemployment rate among women with children under the age of 6 in the United States with a correlation coefficient (R) of 0.400 and weighted average of 7.5%. Similarly, the statistical analysis conducted on geographies consisting of 184,780,625 people shows a moderate positive correlation between the proportion of Australians and unemployment rate among women with children under the age of 6 in the United States with a correlation coefficient (R) of 0.438 and weighted average of 7.2%, a difference of 4.5%.
Unemployment Among Women with Children Under 6 years Correlation Summary
| Measurement | Bolivian | Australian |
| Minimum | 1.4% | 1.9% |
| Maximum | 50.0% | 50.8% |
| Range | 48.6% | 48.9% |
| Mean | 10.3% | 16.5% |
| Median | 6.9% | 10.4% |
| Interquartile 25% (IQ1) | 4.7% | 7.2% |
| Interquartile 75% (IQ3) | 11.4% | 23.7% |
| Interquartile Range (IQR) | 6.8% | 16.5% |
| Standard Deviation (Sample) | 10.1% | 12.7% |
| Standard Deviation (Population) | 10.0% | 12.5% |
Similar Demographics by Unemployment Among Women with Children Under 6 years
Demographics Similar to Bolivians by Unemployment Among Women with Children Under 6 years
In terms of unemployment among women with children under 6 years, the demographic groups most similar to Bolivians are Immigrants from Philippines (7.5%, a difference of 0.040%), Immigrants from Western Asia (7.5%, a difference of 0.040%), Croatian (7.5%, a difference of 0.090%), Peruvian (7.5%, a difference of 0.12%), and Immigrants from Lithuania (7.5%, a difference of 0.16%).
| Demographics | Rating | Rank | Unemployment Among Women with Children Under 6 years |
| Uruguayans | 74.7 /100 | #153 | Good 7.5% |
| Northern Europeans | 74.3 /100 | #154 | Good 7.5% |
| South Americans | 74.1 /100 | #155 | Good 7.5% |
| Immigrants | Southern Europe | 73.2 /100 | #156 | Good 7.5% |
| Peruvians | 72.3 /100 | #157 | Good 7.5% |
| Croatians | 71.9 /100 | #158 | Good 7.5% |
| Immigrants | Philippines | 71.3 /100 | #159 | Good 7.5% |
| Bolivians | 70.8 /100 | #160 | Good 7.5% |
| Immigrants | Western Asia | 70.2 /100 | #161 | Good 7.5% |
| Immigrants | Lithuania | 68.8 /100 | #162 | Good 7.5% |
| British | 66.3 /100 | #163 | Good 7.6% |
| Ugandans | 65.8 /100 | #164 | Good 7.6% |
| Immigrants | South America | 65.6 /100 | #165 | Good 7.6% |
| Belgians | 63.5 /100 | #166 | Good 7.6% |
| Kenyans | 62.5 /100 | #167 | Good 7.6% |
Demographics Similar to Australians by Unemployment Among Women with Children Under 6 years
In terms of unemployment among women with children under 6 years, the demographic groups most similar to Australians are Eastern European (7.2%, a difference of 0.010%), Palestinian (7.2%, a difference of 0.070%), Immigrants from Kazakhstan (7.2%, a difference of 0.13%), Norwegian (7.2%, a difference of 0.13%), and Immigrants from Pakistan (7.2%, a difference of 0.14%).
| Demographics | Rating | Rank | Unemployment Among Women with Children Under 6 years |
| Immigrants | Nicaragua | 97.3 /100 | #102 | Exceptional 7.2% |
| Immigrants | Saudi Arabia | 97.3 /100 | #103 | Exceptional 7.2% |
| Immigrants | Egypt | 97.2 /100 | #104 | Exceptional 7.2% |
| Venezuelans | 97.2 /100 | #105 | Exceptional 7.2% |
| Immigrants | Pakistan | 97.2 /100 | #106 | Exceptional 7.2% |
| Immigrants | Kazakhstan | 97.1 /100 | #107 | Exceptional 7.2% |
| Eastern Europeans | 96.9 /100 | #108 | Exceptional 7.2% |
| Australians | 96.9 /100 | #109 | Exceptional 7.2% |
| Palestinians | 96.8 /100 | #110 | Exceptional 7.2% |
| Norwegians | 96.7 /100 | #111 | Exceptional 7.2% |
| Israelis | 96.5 /100 | #112 | Exceptional 7.2% |
| Nicaraguans | 96.3 /100 | #113 | Exceptional 7.2% |
| Argentineans | 96.2 /100 | #114 | Exceptional 7.2% |
| Immigrants | Italy | 96.1 /100 | #115 | Exceptional 7.2% |
| Armenians | 95.9 /100 | #116 | Exceptional 7.2% |