Immigrants from Korea vs Australian College, Under 1 year
COMPARE
Immigrants from Korea
Australian
College, Under 1 year
College, Under 1 year Comparison
Immigrants from Korea
Australians
71.6%
COLLEGE, UNDER 1 YEAR
100.0/ 100
METRIC RATING
20th/ 347
METRIC RANK
70.4%
COLLEGE, UNDER 1 YEAR
99.9/ 100
METRIC RATING
38th/ 347
METRIC RANK
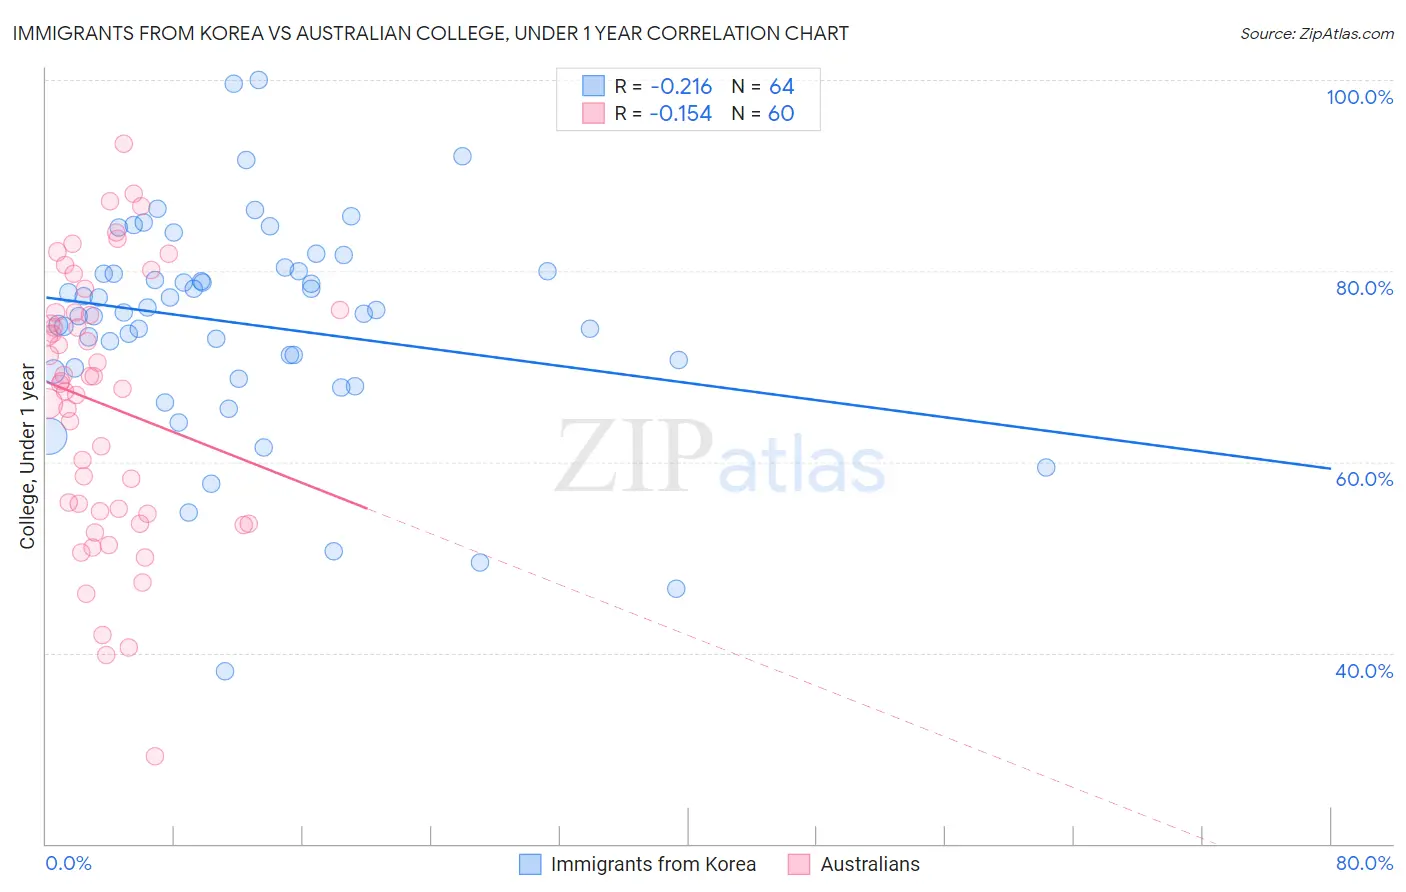
Immigrants from Korea vs Australian College, Under 1 year Correlation Chart
The statistical analysis conducted on geographies consisting of 416,336,700 people shows a weak negative correlation between the proportion of Immigrants from Korea and percentage of population with at least college, under 1 year education in the United States with a correlation coefficient (R) of -0.216 and weighted average of 71.6%. Similarly, the statistical analysis conducted on geographies consisting of 224,162,526 people shows a poor negative correlation between the proportion of Australians and percentage of population with at least college, under 1 year education in the United States with a correlation coefficient (R) of -0.154 and weighted average of 70.4%, a difference of 1.7%.
College, Under 1 year Correlation Summary
| Measurement | Immigrants from Korea | Australian |
| Minimum | 38.0% | 29.1% |
| Maximum | 100.0% | 93.4% |
| Range | 62.0% | 64.2% |
| Mean | 74.4% | 66.0% |
| Median | 75.8% | 68.3% |
| Interquartile 25% (IQ1) | 69.7% | 54.7% |
| Interquartile 75% (IQ3) | 80.0% | 75.6% |
| Interquartile Range (IQR) | 10.3% | 21.0% |
| Standard Deviation (Sample) | 11.4% | 14.0% |
| Standard Deviation (Population) | 11.3% | 13.8% |
Demographics Similar to Immigrants from Korea and Australians by College, Under 1 year
In terms of college, under 1 year, the demographic groups most similar to Immigrants from Korea are Latvian (71.6%, a difference of 0.040%), Immigrants from Belgium (71.5%, a difference of 0.15%), Immigrants from Eastern Asia (71.3%, a difference of 0.40%), Immigrants from Northern Europe (71.1%, a difference of 0.63%), and Soviet Union (71.1%, a difference of 0.64%). Similarly, the demographic groups most similar to Australians are Bhutanese (70.3%, a difference of 0.020%), Immigrants from Saudi Arabia (70.4%, a difference of 0.070%), Immigrants from Sri Lanka (70.5%, a difference of 0.18%), Russian (70.5%, a difference of 0.25%), and Estonian (70.6%, a difference of 0.33%).
| Demographics | Rating | Rank | College, Under 1 year |
| Latvians | 100.0 /100 | #19 | Exceptional 71.6% |
| Immigrants | Korea | 100.0 /100 | #20 | Exceptional 71.6% |
| Immigrants | Belgium | 100.0 /100 | #21 | Exceptional 71.5% |
| Immigrants | Eastern Asia | 100.0 /100 | #22 | Exceptional 71.3% |
| Immigrants | Northern Europe | 100.0 /100 | #23 | Exceptional 71.1% |
| Soviet Union | 100.0 /100 | #24 | Exceptional 71.1% |
| Bulgarians | 100.0 /100 | #25 | Exceptional 71.1% |
| Immigrants | Denmark | 100.0 /100 | #26 | Exceptional 71.0% |
| Immigrants | Ireland | 100.0 /100 | #27 | Exceptional 71.0% |
| Immigrants | Hong Kong | 100.0 /100 | #28 | Exceptional 71.0% |
| Immigrants | France | 100.0 /100 | #29 | Exceptional 71.0% |
| Immigrants | China | 99.9 /100 | #30 | Exceptional 70.9% |
| Indians (Asian) | 99.9 /100 | #31 | Exceptional 70.8% |
| Turks | 99.9 /100 | #32 | Exceptional 70.7% |
| Immigrants | South Africa | 99.9 /100 | #33 | Exceptional 70.6% |
| Estonians | 99.9 /100 | #34 | Exceptional 70.6% |
| Russians | 99.9 /100 | #35 | Exceptional 70.5% |
| Immigrants | Sri Lanka | 99.9 /100 | #36 | Exceptional 70.5% |
| Immigrants | Saudi Arabia | 99.9 /100 | #37 | Exceptional 70.4% |
| Australians | 99.9 /100 | #38 | Exceptional 70.4% |
| Bhutanese | 99.9 /100 | #39 | Exceptional 70.3% |