Black/African American vs Mexican American Indian 8th Grade
COMPARE
Black/African American
Mexican American Indian
8th Grade
8th Grade Comparison
Blacks/African Americans
Mexican American Indians
95.6%
8TH GRADE
34.8/ 100
METRIC RATING
185th/ 347
METRIC RANK
92.1%
8TH GRADE
0.0/ 100
METRIC RATING
335th/ 347
METRIC RANK
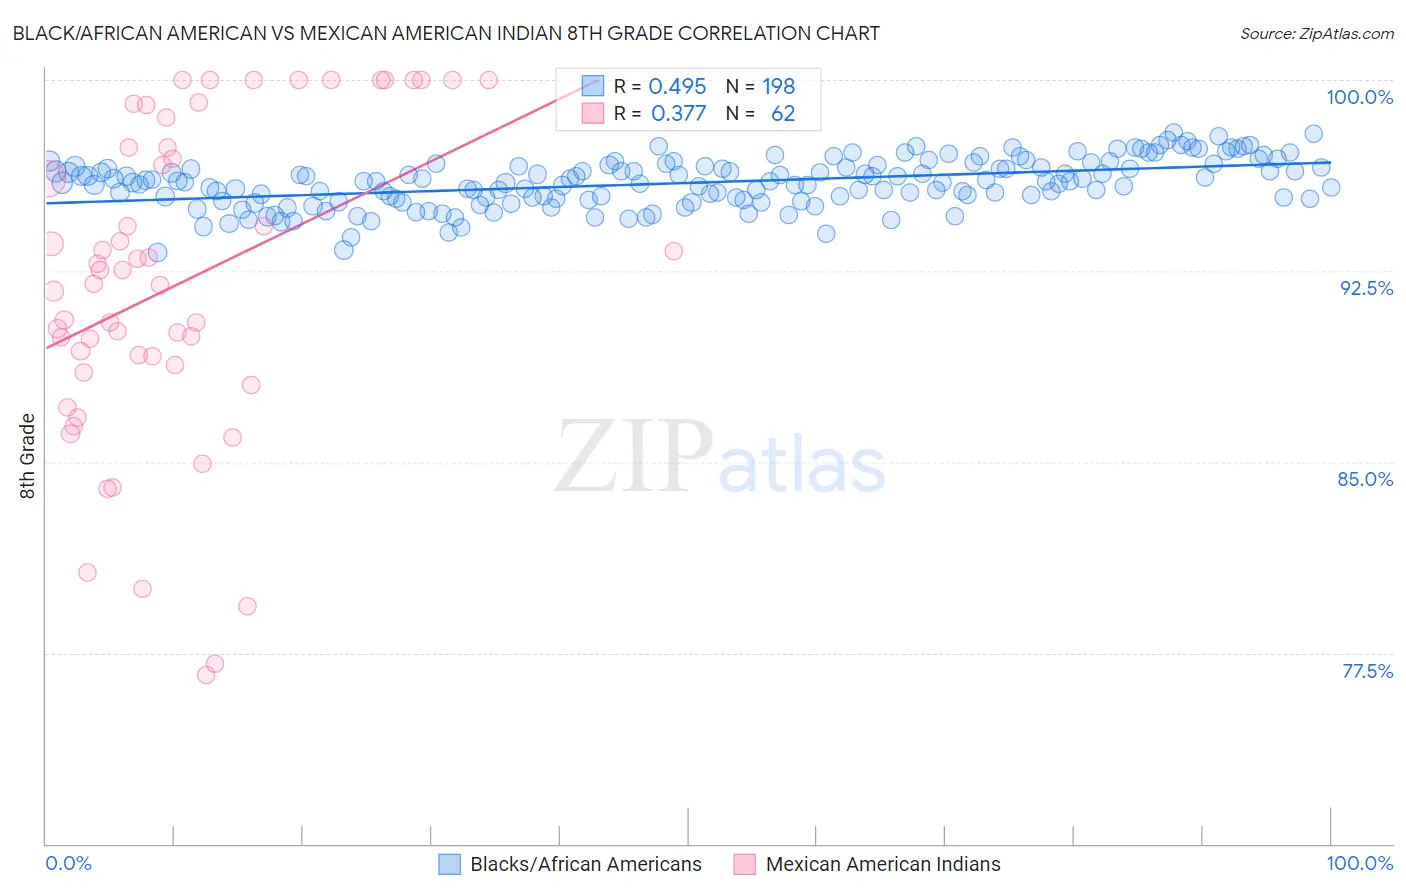
Black/African American vs Mexican American Indian 8th Grade Correlation Chart
The statistical analysis conducted on geographies consisting of 561,177,341 people shows a moderate positive correlation between the proportion of Blacks/African Americans and percentage of population with at least 8th grade education in the United States with a correlation coefficient (R) of 0.495 and weighted average of 95.6%. Similarly, the statistical analysis conducted on geographies consisting of 317,621,104 people shows a mild positive correlation between the proportion of Mexican American Indians and percentage of population with at least 8th grade education in the United States with a correlation coefficient (R) of 0.377 and weighted average of 92.1%, a difference of 3.8%.
8th Grade Correlation Summary
| Measurement | Black/African American | Mexican American Indian |
| Minimum | 93.2% | 76.6% |
| Maximum | 98.0% | 100.0% |
| Range | 4.7% | 23.4% |
| Mean | 96.0% | 92.0% |
| Median | 96.0% | 92.3% |
| Interquartile 25% (IQ1) | 95.3% | 88.8% |
| Interquartile 75% (IQ3) | 96.6% | 97.4% |
| Interquartile Range (IQR) | 1.3% | 8.6% |
| Standard Deviation (Sample) | 0.93% | 6.2% |
| Standard Deviation (Population) | 0.93% | 6.2% |
Similar Demographics by 8th Grade
Demographics Similar to Blacks/African Americans by 8th Grade
In terms of 8th grade, the demographic groups most similar to Blacks/African Americans are Brazilian (95.6%, a difference of 0.0%), Immigrants from Iraq (95.6%, a difference of 0.010%), Immigrants from Uganda (95.6%, a difference of 0.010%), Sudanese (95.6%, a difference of 0.010%), and Immigrants from Egypt (95.7%, a difference of 0.020%).
| Demographics | Rating | Rank | 8th Grade |
| Venezuelans | 47.5 /100 | #178 | Average 95.7% |
| Immigrants | Brazil | 45.4 /100 | #179 | Average 95.7% |
| Iraqis | 40.5 /100 | #180 | Average 95.7% |
| Immigrants | Spain | 38.7 /100 | #181 | Fair 95.7% |
| Immigrants | Egypt | 37.9 /100 | #182 | Fair 95.7% |
| Immigrants | Iraq | 36.2 /100 | #183 | Fair 95.6% |
| Immigrants | Uganda | 36.0 /100 | #184 | Fair 95.6% |
| Blacks/African Americans | 34.8 /100 | #185 | Fair 95.6% |
| Brazilians | 34.8 /100 | #186 | Fair 95.6% |
| Sudanese | 33.0 /100 | #187 | Fair 95.6% |
| Liberians | 32.4 /100 | #188 | Fair 95.6% |
| Immigrants | Micronesia | 31.6 /100 | #189 | Fair 95.6% |
| Immigrants | Venezuela | 30.8 /100 | #190 | Fair 95.6% |
| Immigrants | Nepal | 30.2 /100 | #191 | Fair 95.6% |
| Pima | 28.6 /100 | #192 | Fair 95.6% |
Demographics Similar to Mexican American Indians by 8th Grade
In terms of 8th grade, the demographic groups most similar to Mexican American Indians are Immigrants from Yemen (92.1%, a difference of 0.050%), Hispanic or Latino (92.2%, a difference of 0.11%), Immigrants from Honduras (91.9%, a difference of 0.19%), Immigrants from Dominican Republic (92.3%, a difference of 0.22%), and Honduran (92.3%, a difference of 0.24%).
| Demographics | Rating | Rank | 8th Grade |
| Immigrants | Nicaragua | 0.0 /100 | #328 | Tragic 92.5% |
| Immigrants | Cabo Verde | 0.0 /100 | #329 | Tragic 92.4% |
| Immigrants | Armenia | 0.0 /100 | #330 | Tragic 92.3% |
| Hondurans | 0.0 /100 | #331 | Tragic 92.3% |
| Immigrants | Dominican Republic | 0.0 /100 | #332 | Tragic 92.3% |
| Hispanics or Latinos | 0.0 /100 | #333 | Tragic 92.2% |
| Immigrants | Yemen | 0.0 /100 | #334 | Tragic 92.1% |
| Mexican American Indians | 0.0 /100 | #335 | Tragic 92.1% |
| Immigrants | Honduras | 0.0 /100 | #336 | Tragic 91.9% |
| Immigrants | Latin America | 0.0 /100 | #337 | Tragic 91.7% |
| Central Americans | 0.0 /100 | #338 | Tragic 91.6% |
| Mexicans | 0.0 /100 | #339 | Tragic 91.4% |
| Yakama | 0.0 /100 | #340 | Tragic 91.2% |
| Guatemalans | 0.0 /100 | #341 | Tragic 91.1% |
| Salvadorans | 0.0 /100 | #342 | Tragic 90.9% |