Black/African American vs Immigrants from Lithuania 8th Grade
COMPARE
Black/African American
Immigrants from Lithuania
8th Grade
8th Grade Comparison
Blacks/African Americans
Immigrants from Lithuania
95.6%
8TH GRADE
34.8/ 100
METRIC RATING
185th/ 347
METRIC RANK
96.6%
8TH GRADE
99.6/ 100
METRIC RATING
70th/ 347
METRIC RANK
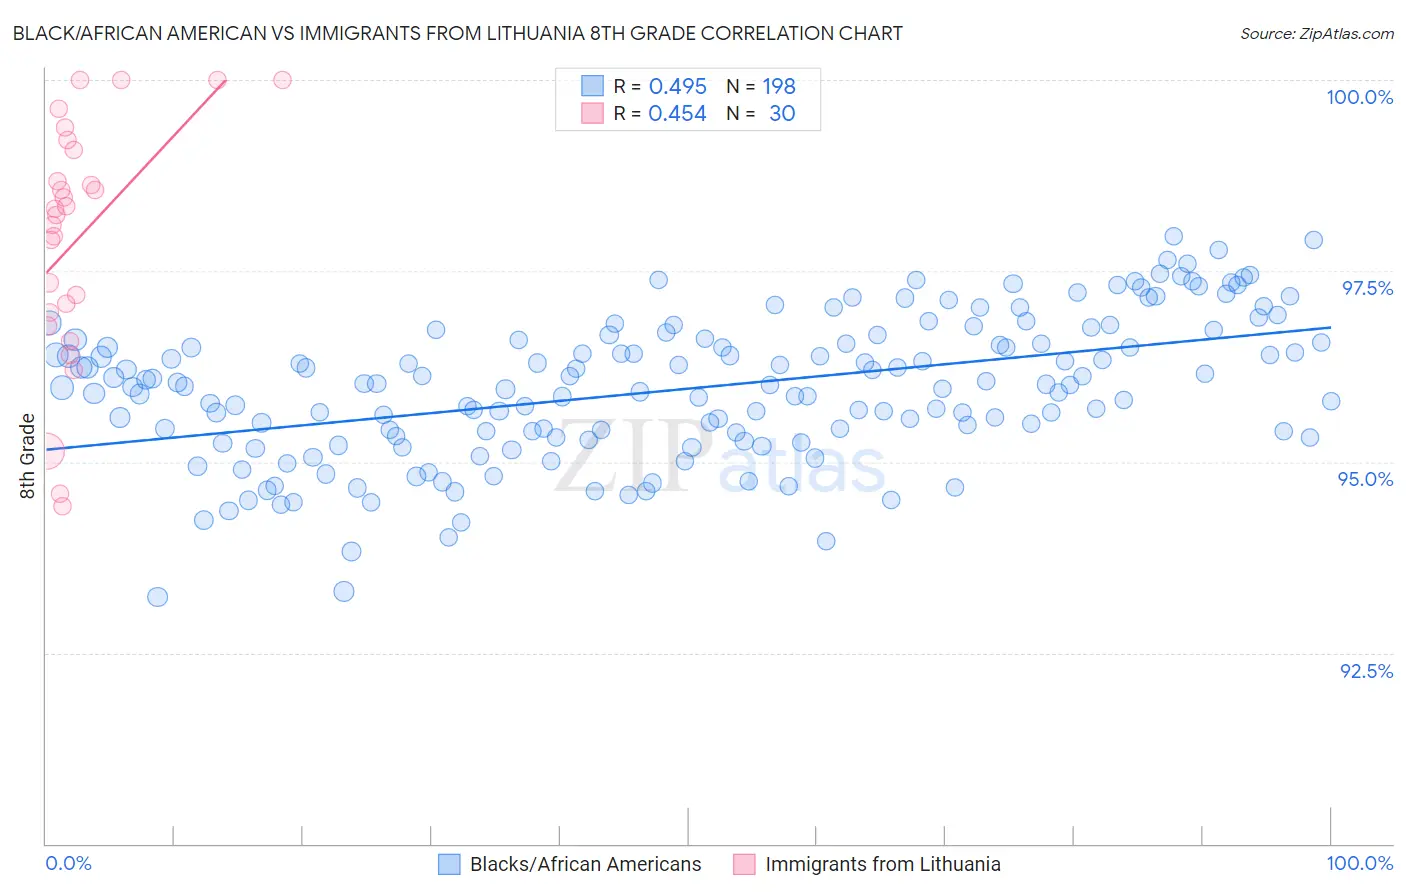
Black/African American vs Immigrants from Lithuania 8th Grade Correlation Chart
The statistical analysis conducted on geographies consisting of 561,177,341 people shows a moderate positive correlation between the proportion of Blacks/African Americans and percentage of population with at least 8th grade education in the United States with a correlation coefficient (R) of 0.495 and weighted average of 95.6%. Similarly, the statistical analysis conducted on geographies consisting of 117,724,932 people shows a moderate positive correlation between the proportion of Immigrants from Lithuania and percentage of population with at least 8th grade education in the United States with a correlation coefficient (R) of 0.454 and weighted average of 96.6%, a difference of 1.0%.
8th Grade Correlation Summary
| Measurement | Black/African American | Immigrants from Lithuania |
| Minimum | 93.2% | 94.4% |
| Maximum | 98.0% | 100.0% |
| Range | 4.7% | 5.6% |
| Mean | 96.0% | 97.9% |
| Median | 96.0% | 98.3% |
| Interquartile 25% (IQ1) | 95.3% | 97.0% |
| Interquartile 75% (IQ3) | 96.6% | 99.1% |
| Interquartile Range (IQR) | 1.3% | 2.1% |
| Standard Deviation (Sample) | 0.93% | 1.6% |
| Standard Deviation (Population) | 0.93% | 1.5% |
Similar Demographics by 8th Grade
Demographics Similar to Blacks/African Americans by 8th Grade
In terms of 8th grade, the demographic groups most similar to Blacks/African Americans are Brazilian (95.6%, a difference of 0.0%), Immigrants from Iraq (95.6%, a difference of 0.010%), Immigrants from Uganda (95.6%, a difference of 0.010%), Sudanese (95.6%, a difference of 0.010%), and Immigrants from Egypt (95.7%, a difference of 0.020%).
| Demographics | Rating | Rank | 8th Grade |
| Venezuelans | 47.5 /100 | #178 | Average 95.7% |
| Immigrants | Brazil | 45.4 /100 | #179 | Average 95.7% |
| Iraqis | 40.5 /100 | #180 | Average 95.7% |
| Immigrants | Spain | 38.7 /100 | #181 | Fair 95.7% |
| Immigrants | Egypt | 37.9 /100 | #182 | Fair 95.7% |
| Immigrants | Iraq | 36.2 /100 | #183 | Fair 95.6% |
| Immigrants | Uganda | 36.0 /100 | #184 | Fair 95.6% |
| Blacks/African Americans | 34.8 /100 | #185 | Fair 95.6% |
| Brazilians | 34.8 /100 | #186 | Fair 95.6% |
| Sudanese | 33.0 /100 | #187 | Fair 95.6% |
| Liberians | 32.4 /100 | #188 | Fair 95.6% |
| Immigrants | Micronesia | 31.6 /100 | #189 | Fair 95.6% |
| Immigrants | Venezuela | 30.8 /100 | #190 | Fair 95.6% |
| Immigrants | Nepal | 30.2 /100 | #191 | Fair 95.6% |
| Pima | 28.6 /100 | #192 | Fair 95.6% |
Demographics Similar to Immigrants from Lithuania by 8th Grade
In terms of 8th grade, the demographic groups most similar to Immigrants from Lithuania are American (96.6%, a difference of 0.020%), Creek (96.6%, a difference of 0.030%), Iranian (96.6%, a difference of 0.040%), Ukrainian (96.7%, a difference of 0.050%), and Immigrants from India (96.6%, a difference of 0.050%).
| Demographics | Rating | Rank | 8th Grade |
| Ukrainians | 99.7 /100 | #63 | Exceptional 96.7% |
| Immigrants | India | 99.7 /100 | #64 | Exceptional 96.6% |
| Native Hawaiians | 99.7 /100 | #65 | Exceptional 96.6% |
| Canadians | 99.7 /100 | #66 | Exceptional 96.6% |
| Iranians | 99.7 /100 | #67 | Exceptional 96.6% |
| Creek | 99.7 /100 | #68 | Exceptional 96.6% |
| Americans | 99.7 /100 | #69 | Exceptional 96.6% |
| Immigrants | Lithuania | 99.6 /100 | #70 | Exceptional 96.6% |
| New Zealanders | 99.5 /100 | #71 | Exceptional 96.6% |
| Immigrants | England | 99.5 /100 | #72 | Exceptional 96.6% |
| Arapaho | 99.5 /100 | #73 | Exceptional 96.6% |
| Immigrants | Ireland | 99.5 /100 | #74 | Exceptional 96.5% |
| Zimbabweans | 99.4 /100 | #75 | Exceptional 96.5% |
| Immigrants | Netherlands | 99.4 /100 | #76 | Exceptional 96.5% |
| Cypriots | 99.4 /100 | #77 | Exceptional 96.5% |