Black/African American vs Immigrants from Korea 7th Grade
COMPARE
Black/African American
Immigrants from Korea
7th Grade
7th Grade Comparison
Blacks/African Americans
Immigrants from Korea
96.0%
7TH GRADE
49.5/ 100
METRIC RATING
175th/ 347
METRIC RANK
96.0%
7TH GRADE
49.2/ 100
METRIC RATING
177th/ 347
METRIC RANK
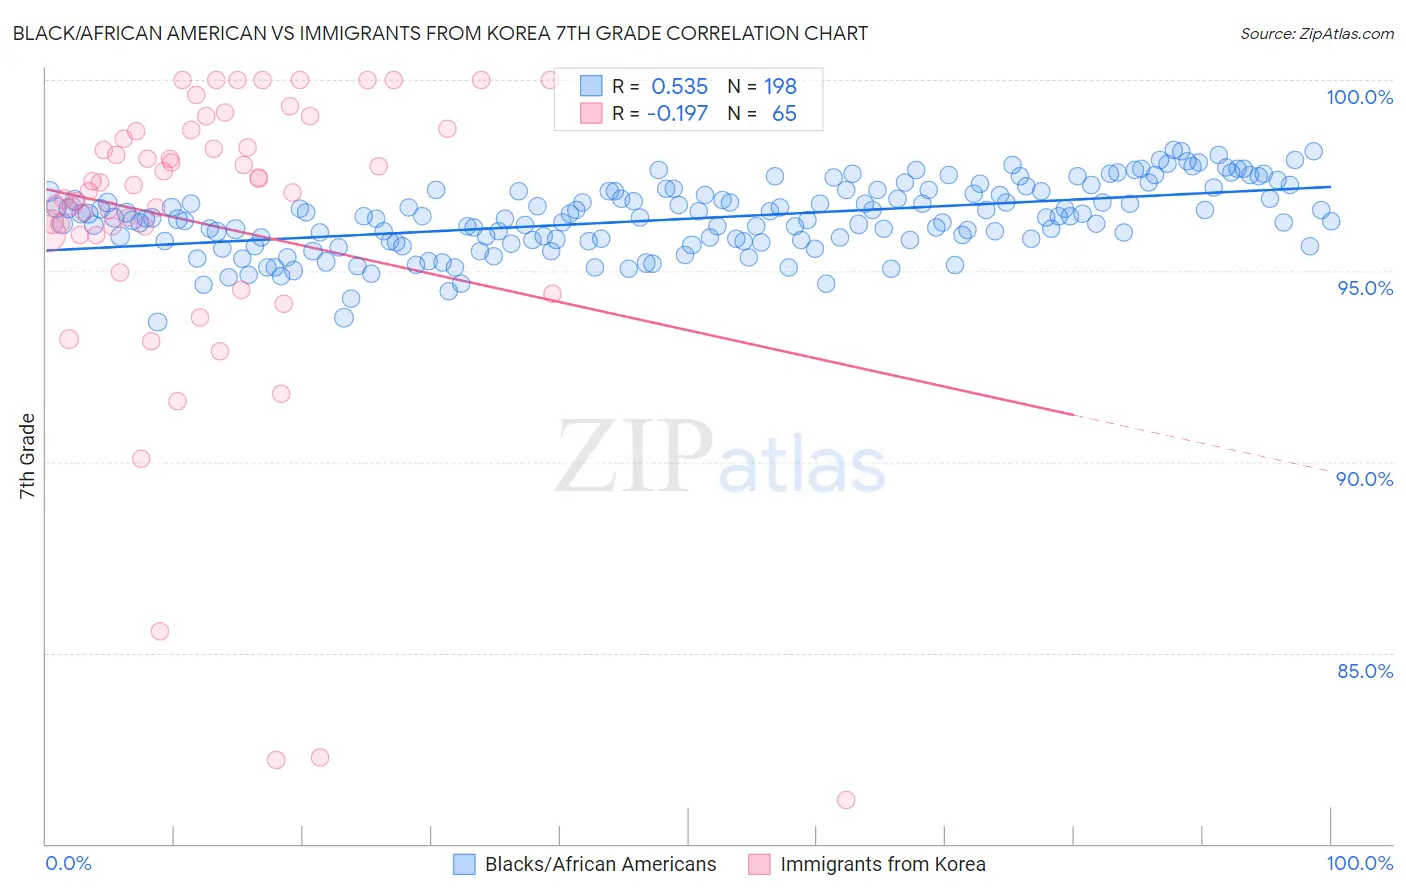
Black/African American vs Immigrants from Korea 7th Grade Correlation Chart
The statistical analysis conducted on geographies consisting of 561,177,341 people shows a substantial positive correlation between the proportion of Blacks/African Americans and percentage of population with at least 7th grade education in the United States with a correlation coefficient (R) of 0.535 and weighted average of 96.0%. Similarly, the statistical analysis conducted on geographies consisting of 416,280,217 people shows a poor negative correlation between the proportion of Immigrants from Korea and percentage of population with at least 7th grade education in the United States with a correlation coefficient (R) of -0.197 and weighted average of 96.0%, a difference of 0.0%.
7th Grade Correlation Summary
| Measurement | Black/African American | Immigrants from Korea |
| Minimum | 93.7% | 81.1% |
| Maximum | 98.2% | 100.0% |
| Range | 4.5% | 18.9% |
| Mean | 96.4% | 96.2% |
| Median | 96.4% | 97.2% |
| Interquartile 25% (IQ1) | 95.8% | 95.9% |
| Interquartile 75% (IQ3) | 97.1% | 98.7% |
| Interquartile Range (IQR) | 1.3% | 2.7% |
| Standard Deviation (Sample) | 0.90% | 4.1% |
| Standard Deviation (Population) | 0.89% | 4.1% |
Demographics Similar to Blacks/African Americans and Immigrants from Korea by 7th Grade
In terms of 7th grade, the demographic groups most similar to Blacks/African Americans are Mongolian (96.0%, a difference of 0.0%), Chilean (96.0%, a difference of 0.0%), Venezuelan (96.0%, a difference of 0.010%), Immigrants from Albania (96.0%, a difference of 0.010%), and Marshallese (96.0%, a difference of 0.010%). Similarly, the demographic groups most similar to Immigrants from Korea are Chilean (96.0%, a difference of 0.0%), Marshallese (96.0%, a difference of 0.0%), Venezuelan (96.0%, a difference of 0.010%), Immigrants from Albania (96.0%, a difference of 0.010%), and Mongolian (96.0%, a difference of 0.010%).
| Demographics | Rating | Rank | 7th Grade |
| Immigrants | Kazakhstan | 61.0 /100 | #166 | Good 96.1% |
| Immigrants | Sri Lanka | 59.9 /100 | #167 | Average 96.1% |
| Immigrants | Poland | 59.0 /100 | #168 | Average 96.1% |
| Ute | 55.8 /100 | #169 | Average 96.1% |
| Immigrants | Ukraine | 55.0 /100 | #170 | Average 96.1% |
| Egyptians | 54.2 /100 | #171 | Average 96.1% |
| Venezuelans | 51.4 /100 | #172 | Average 96.0% |
| Immigrants | Albania | 50.4 /100 | #173 | Average 96.0% |
| Mongolians | 50.0 /100 | #174 | Average 96.0% |
| Blacks/African Americans | 49.5 /100 | #175 | Average 96.0% |
| Chileans | 49.3 /100 | #176 | Average 96.0% |
| Immigrants | Korea | 49.2 /100 | #177 | Average 96.0% |
| Marshallese | 48.4 /100 | #178 | Average 96.0% |
| Immigrants | Iran | 47.8 /100 | #179 | Average 96.0% |
| Immigrants | Brazil | 46.8 /100 | #180 | Average 96.0% |
| Pakistanis | 44.5 /100 | #181 | Average 96.0% |
| Iraqis | 41.2 /100 | #182 | Average 96.0% |
| Immigrants | Spain | 38.8 /100 | #183 | Fair 96.0% |
| Sierra Leoneans | 37.5 /100 | #184 | Fair 96.0% |
| Brazilians | 37.3 /100 | #185 | Fair 96.0% |
| Immigrants | Iraq | 36.1 /100 | #186 | Fair 96.0% |