Turkish vs Immigrants from Ecuador 7th Grade
COMPARE
Turkish
Immigrants from Ecuador
7th Grade
7th Grade Comparison
Turks
Immigrants from Ecuador
96.7%
7TH GRADE
99.1/ 100
METRIC RATING
86th/ 347
METRIC RANK
93.7%
7TH GRADE
0.0/ 100
METRIC RATING
318th/ 347
METRIC RANK
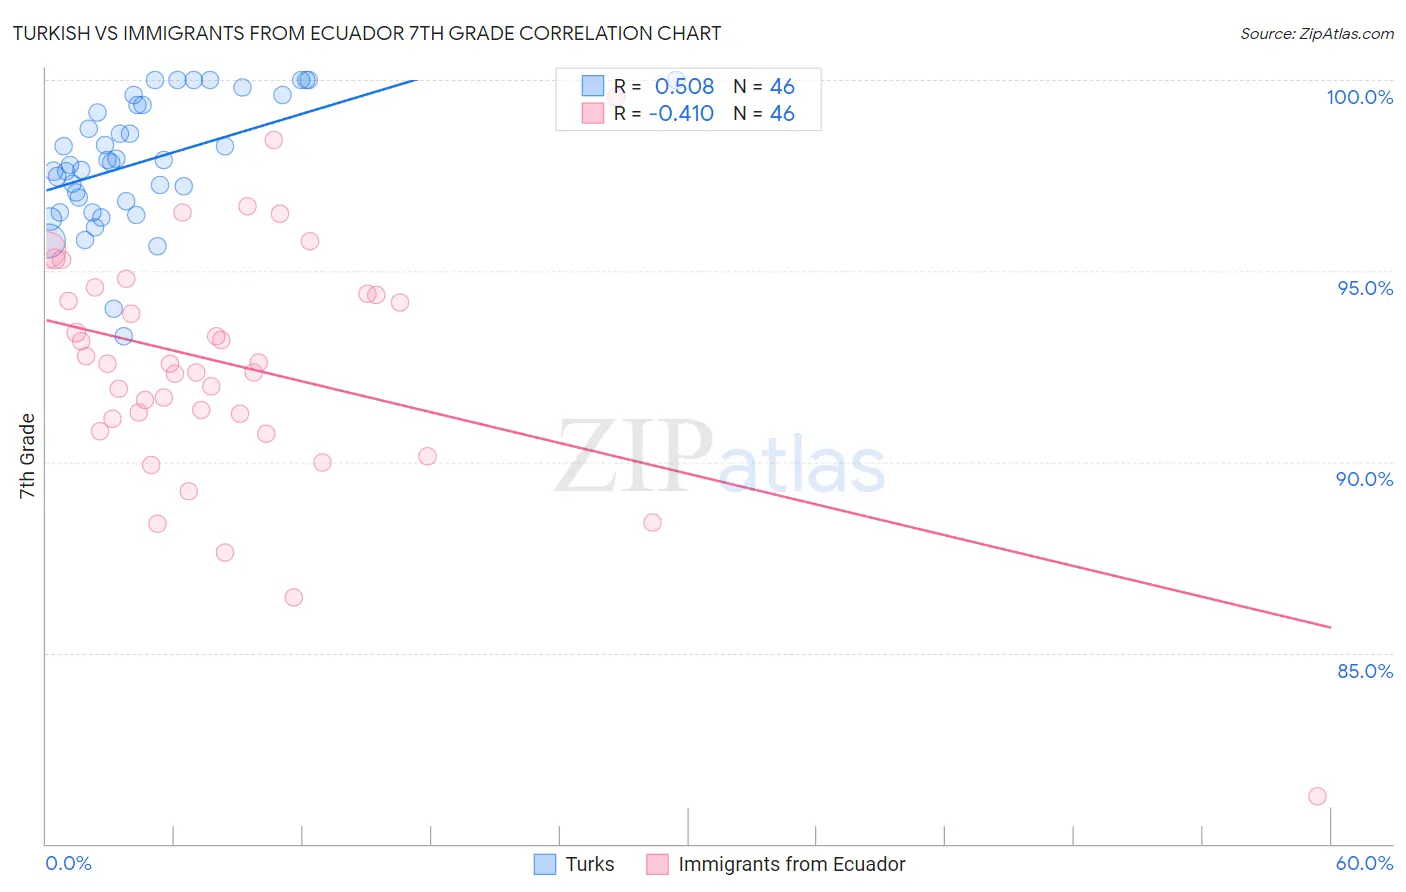
Turkish vs Immigrants from Ecuador 7th Grade Correlation Chart
The statistical analysis conducted on geographies consisting of 271,858,657 people shows a substantial positive correlation between the proportion of Turks and percentage of population with at least 7th grade education in the United States with a correlation coefficient (R) of 0.508 and weighted average of 96.7%. Similarly, the statistical analysis conducted on geographies consisting of 270,907,929 people shows a moderate negative correlation between the proportion of Immigrants from Ecuador and percentage of population with at least 7th grade education in the United States with a correlation coefficient (R) of -0.410 and weighted average of 93.7%, a difference of 3.2%.
7th Grade Correlation Summary
| Measurement | Turkish | Immigrants from Ecuador |
| Minimum | 93.3% | 81.2% |
| Maximum | 100.0% | 99.5% |
| Range | 6.7% | 18.3% |
| Mean | 97.9% | 92.5% |
| Median | 97.9% | 92.6% |
| Interquartile 25% (IQ1) | 96.8% | 91.1% |
| Interquartile 75% (IQ3) | 99.4% | 94.4% |
| Interquartile Range (IQR) | 2.5% | 3.3% |
| Standard Deviation (Sample) | 1.6% | 3.2% |
| Standard Deviation (Population) | 1.6% | 3.2% |
Similar Demographics by 7th Grade
Demographics Similar to Turks by 7th Grade
In terms of 7th grade, the demographic groups most similar to Turks are Icelander (96.7%, a difference of 0.010%), Romanian (96.7%, a difference of 0.010%), Kiowa (96.7%, a difference of 0.010%), Immigrants from Belgium (96.7%, a difference of 0.010%), and Puget Sound Salish (96.7%, a difference of 0.010%).
| Demographics | Rating | Rank | 7th Grade |
| Cypriots | 99.3 /100 | #79 | Exceptional 96.8% |
| Yugoslavians | 99.3 /100 | #80 | Exceptional 96.8% |
| Delaware | 99.2 /100 | #81 | Exceptional 96.8% |
| Chickasaw | 99.2 /100 | #82 | Exceptional 96.7% |
| Icelanders | 99.1 /100 | #83 | Exceptional 96.7% |
| Romanians | 99.1 /100 | #84 | Exceptional 96.7% |
| Kiowa | 99.1 /100 | #85 | Exceptional 96.7% |
| Turks | 99.1 /100 | #86 | Exceptional 96.7% |
| Immigrants | Belgium | 99.0 /100 | #87 | Exceptional 96.7% |
| Puget Sound Salish | 99.0 /100 | #88 | Exceptional 96.7% |
| Cree | 99.0 /100 | #89 | Exceptional 96.7% |
| Immigrants | South Africa | 98.9 /100 | #90 | Exceptional 96.7% |
| Osage | 98.9 /100 | #91 | Exceptional 96.7% |
| Immigrants | Western Europe | 98.9 /100 | #92 | Exceptional 96.7% |
| Potawatomi | 98.9 /100 | #93 | Exceptional 96.7% |
Demographics Similar to Immigrants from Ecuador by 7th Grade
In terms of 7th grade, the demographic groups most similar to Immigrants from Ecuador are Immigrants from Cambodia (93.7%, a difference of 0.030%), Immigrants from Cuba (93.8%, a difference of 0.080%), Immigrants from Vietnam (93.9%, a difference of 0.16%), Vietnamese (93.9%, a difference of 0.19%), and Immigrants from Fiji (93.5%, a difference of 0.21%).
| Demographics | Rating | Rank | 7th Grade |
| Puerto Ricans | 0.0 /100 | #311 | Tragic 94.0% |
| Immigrants | Immigrants | 0.0 /100 | #312 | Tragic 94.0% |
| Immigrants | Bangladesh | 0.0 /100 | #313 | Tragic 94.0% |
| Japanese | 0.0 /100 | #314 | Tragic 94.0% |
| Vietnamese | 0.0 /100 | #315 | Tragic 93.9% |
| Immigrants | Vietnam | 0.0 /100 | #316 | Tragic 93.9% |
| Immigrants | Cuba | 0.0 /100 | #317 | Tragic 93.8% |
| Immigrants | Ecuador | 0.0 /100 | #318 | Tragic 93.7% |
| Immigrants | Cambodia | 0.0 /100 | #319 | Tragic 93.7% |
| Immigrants | Fiji | 0.0 /100 | #320 | Tragic 93.5% |
| Belizeans | 0.0 /100 | #321 | Tragic 93.5% |
| Nicaraguans | 0.0 /100 | #322 | Tragic 93.5% |
| Immigrants | Belize | 0.0 /100 | #323 | Tragic 93.4% |
| Dominicans | 0.0 /100 | #324 | Tragic 93.3% |
| Central American Indians | 0.0 /100 | #325 | Tragic 93.3% |