Black/African American vs Afghan 7th Grade
COMPARE
Black/African American
Afghan
7th Grade
7th Grade Comparison
Blacks/African Americans
Afghans
96.0%
7TH GRADE
49.5/ 100
METRIC RATING
175th/ 347
METRIC RANK
95.3%
7TH GRADE
0.5/ 100
METRIC RATING
260th/ 347
METRIC RANK
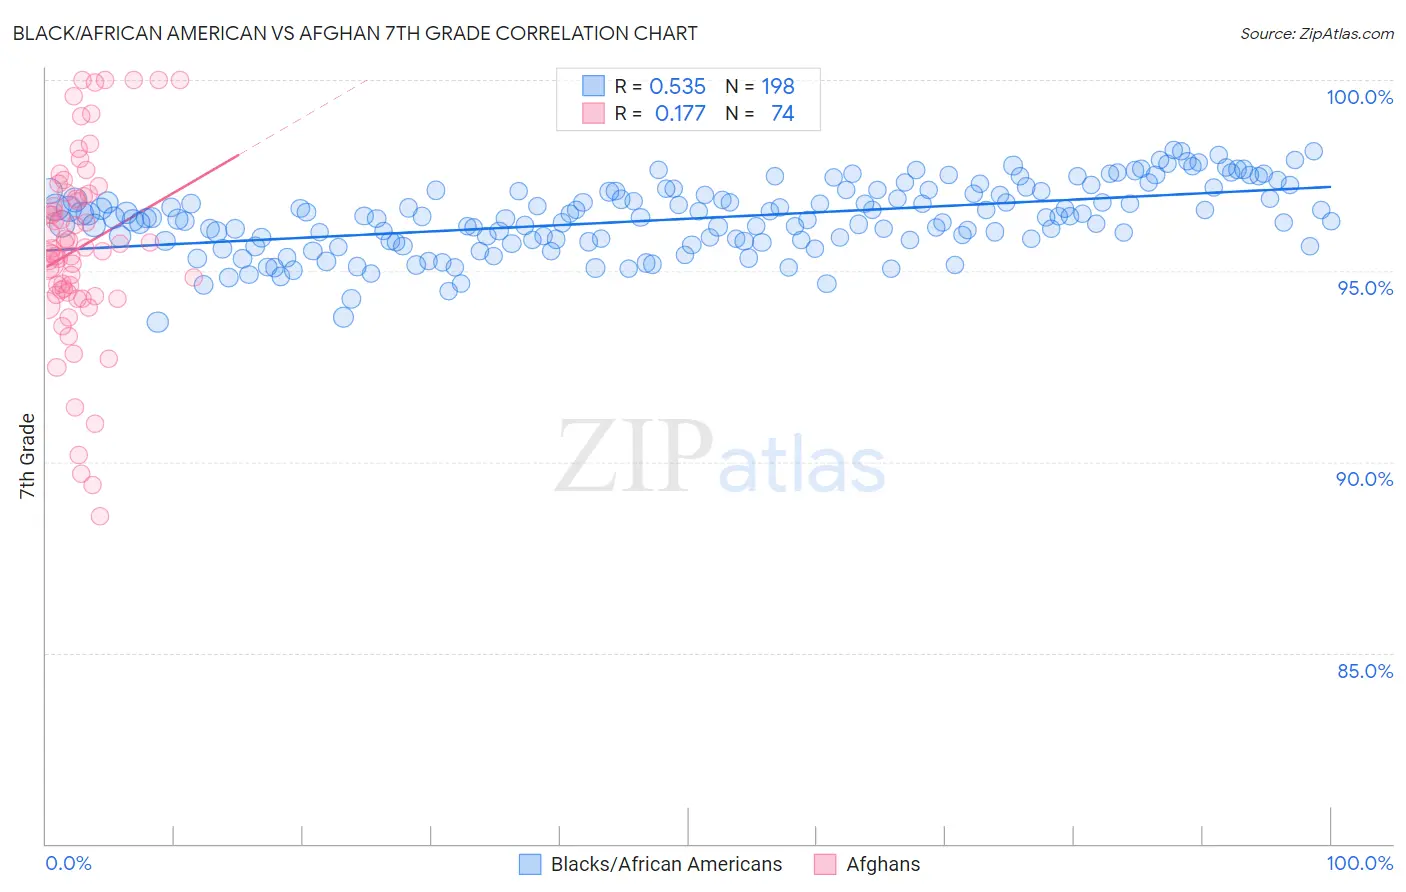
Black/African American vs Afghan 7th Grade Correlation Chart
The statistical analysis conducted on geographies consisting of 561,177,341 people shows a substantial positive correlation between the proportion of Blacks/African Americans and percentage of population with at least 7th grade education in the United States with a correlation coefficient (R) of 0.535 and weighted average of 96.0%. Similarly, the statistical analysis conducted on geographies consisting of 148,851,685 people shows a poor positive correlation between the proportion of Afghans and percentage of population with at least 7th grade education in the United States with a correlation coefficient (R) of 0.177 and weighted average of 95.3%, a difference of 0.82%.
7th Grade Correlation Summary
| Measurement | Black/African American | Afghan |
| Minimum | 93.7% | 88.6% |
| Maximum | 98.2% | 100.0% |
| Range | 4.5% | 11.4% |
| Mean | 96.4% | 95.6% |
| Median | 96.4% | 95.6% |
| Interquartile 25% (IQ1) | 95.8% | 94.4% |
| Interquartile 75% (IQ3) | 97.1% | 97.0% |
| Interquartile Range (IQR) | 1.3% | 2.7% |
| Standard Deviation (Sample) | 0.90% | 2.5% |
| Standard Deviation (Population) | 0.89% | 2.5% |
Similar Demographics by 7th Grade
Demographics Similar to Blacks/African Americans by 7th Grade
In terms of 7th grade, the demographic groups most similar to Blacks/African Americans are Mongolian (96.0%, a difference of 0.0%), Chilean (96.0%, a difference of 0.0%), Immigrants from Korea (96.0%, a difference of 0.0%), Venezuelan (96.0%, a difference of 0.010%), and Immigrants from Albania (96.0%, a difference of 0.010%).
| Demographics | Rating | Rank | 7th Grade |
| Immigrants | Poland | 59.0 /100 | #168 | Average 96.1% |
| Ute | 55.8 /100 | #169 | Average 96.1% |
| Immigrants | Ukraine | 55.0 /100 | #170 | Average 96.1% |
| Egyptians | 54.2 /100 | #171 | Average 96.1% |
| Venezuelans | 51.4 /100 | #172 | Average 96.0% |
| Immigrants | Albania | 50.4 /100 | #173 | Average 96.0% |
| Mongolians | 50.0 /100 | #174 | Average 96.0% |
| Blacks/African Americans | 49.5 /100 | #175 | Average 96.0% |
| Chileans | 49.3 /100 | #176 | Average 96.0% |
| Immigrants | Korea | 49.2 /100 | #177 | Average 96.0% |
| Marshallese | 48.4 /100 | #178 | Average 96.0% |
| Immigrants | Iran | 47.8 /100 | #179 | Average 96.0% |
| Immigrants | Brazil | 46.8 /100 | #180 | Average 96.0% |
| Pakistanis | 44.5 /100 | #181 | Average 96.0% |
| Iraqis | 41.2 /100 | #182 | Average 96.0% |
Demographics Similar to Afghans by 7th Grade
In terms of 7th grade, the demographic groups most similar to Afghans are South American (95.2%, a difference of 0.010%), Immigrants from Somalia (95.2%, a difference of 0.010%), West Indian (95.2%, a difference of 0.010%), Immigrants from Nigeria (95.2%, a difference of 0.020%), and Immigrants from Costa Rica (95.3%, a difference of 0.030%).
| Demographics | Rating | Rank | 7th Grade |
| Somalis | 0.9 /100 | #253 | Tragic 95.3% |
| Colombians | 0.8 /100 | #254 | Tragic 95.3% |
| Koreans | 0.8 /100 | #255 | Tragic 95.3% |
| Immigrants | China | 0.7 /100 | #256 | Tragic 95.3% |
| Immigrants | Congo | 0.7 /100 | #257 | Tragic 95.3% |
| Ghanaians | 0.7 /100 | #258 | Tragic 95.3% |
| Immigrants | Costa Rica | 0.6 /100 | #259 | Tragic 95.3% |
| Afghans | 0.5 /100 | #260 | Tragic 95.3% |
| South Americans | 0.5 /100 | #261 | Tragic 95.2% |
| Immigrants | Somalia | 0.5 /100 | #262 | Tragic 95.2% |
| West Indians | 0.5 /100 | #263 | Tragic 95.2% |
| Immigrants | Nigeria | 0.4 /100 | #264 | Tragic 95.2% |
| Immigrants | Uruguay | 0.3 /100 | #265 | Tragic 95.2% |
| Immigrants | Ghana | 0.3 /100 | #266 | Tragic 95.2% |
| Yuman | 0.3 /100 | #267 | Tragic 95.2% |