Immigrants from Zimbabwe vs Immigrants from Ecuador 7th Grade
COMPARE
Immigrants from Zimbabwe
Immigrants from Ecuador
7th Grade
7th Grade Comparison
Immigrants from Zimbabwe
Immigrants from Ecuador
96.5%
7TH GRADE
96.6/ 100
METRIC RATING
114th/ 347
METRIC RANK
93.7%
7TH GRADE
0.0/ 100
METRIC RATING
318th/ 347
METRIC RANK
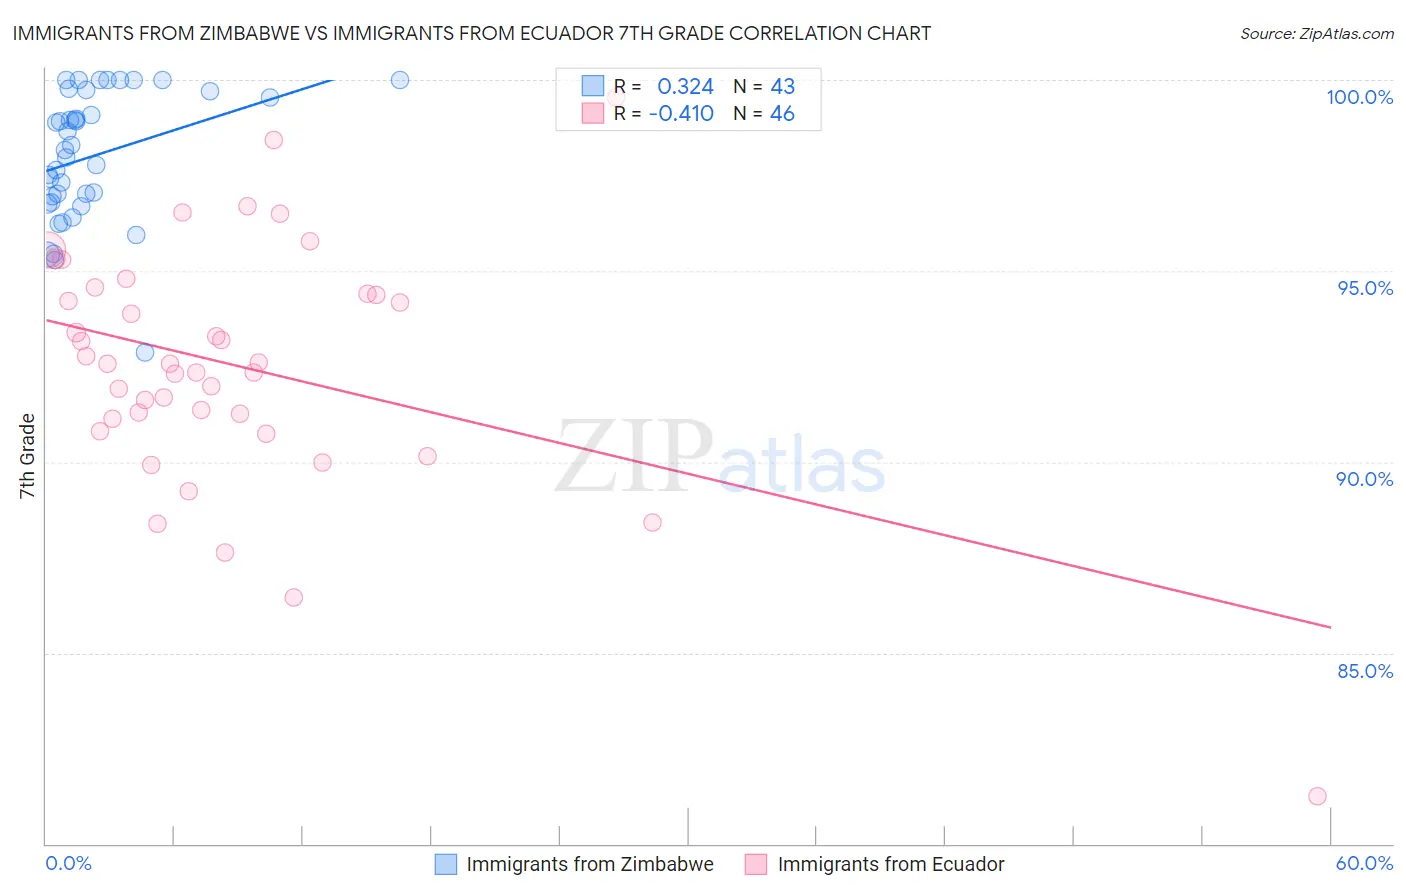
Immigrants from Zimbabwe vs Immigrants from Ecuador 7th Grade Correlation Chart
The statistical analysis conducted on geographies consisting of 117,756,150 people shows a mild positive correlation between the proportion of Immigrants from Zimbabwe and percentage of population with at least 7th grade education in the United States with a correlation coefficient (R) of 0.324 and weighted average of 96.5%. Similarly, the statistical analysis conducted on geographies consisting of 270,907,929 people shows a moderate negative correlation between the proportion of Immigrants from Ecuador and percentage of population with at least 7th grade education in the United States with a correlation coefficient (R) of -0.410 and weighted average of 93.7%, a difference of 3.0%.
7th Grade Correlation Summary
| Measurement | Immigrants from Zimbabwe | Immigrants from Ecuador |
| Minimum | 92.9% | 81.2% |
| Maximum | 100.0% | 99.5% |
| Range | 7.1% | 18.3% |
| Mean | 98.0% | 92.5% |
| Median | 98.2% | 92.6% |
| Interquartile 25% (IQ1) | 96.8% | 91.1% |
| Interquartile 75% (IQ3) | 99.7% | 94.4% |
| Interquartile Range (IQR) | 2.9% | 3.3% |
| Standard Deviation (Sample) | 1.7% | 3.2% |
| Standard Deviation (Population) | 1.7% | 3.2% |
Similar Demographics by 7th Grade
Demographics Similar to Immigrants from Zimbabwe by 7th Grade
In terms of 7th grade, the demographic groups most similar to Immigrants from Zimbabwe are Choctaw (96.5%, a difference of 0.0%), Syrian (96.5%, a difference of 0.0%), Pueblo (96.5%, a difference of 0.010%), Nonimmigrants (96.5%, a difference of 0.020%), and Okinawan (96.6%, a difference of 0.040%).
| Demographics | Rating | Rank | 7th Grade |
| Lumbee | 97.8 /100 | #107 | Exceptional 96.6% |
| Immigrants | Saudi Arabia | 97.8 /100 | #108 | Exceptional 96.6% |
| Bhutanese | 97.7 /100 | #109 | Exceptional 96.6% |
| Okinawans | 97.4 /100 | #110 | Exceptional 96.6% |
| Immigrants | Latvia | 97.4 /100 | #111 | Exceptional 96.6% |
| Immigrants | Nonimmigrants | 97.0 /100 | #112 | Exceptional 96.5% |
| Pueblo | 96.8 /100 | #113 | Exceptional 96.5% |
| Immigrants | Zimbabwe | 96.6 /100 | #114 | Exceptional 96.5% |
| Choctaw | 96.6 /100 | #115 | Exceptional 96.5% |
| Syrians | 96.6 /100 | #116 | Exceptional 96.5% |
| Immigrants | Moldova | 95.7 /100 | #117 | Exceptional 96.5% |
| Immigrants | Japan | 95.5 /100 | #118 | Exceptional 96.5% |
| Immigrants | Norway | 95.2 /100 | #119 | Exceptional 96.5% |
| Immigrants | Croatia | 95.0 /100 | #120 | Exceptional 96.5% |
| Cheyenne | 94.9 /100 | #121 | Exceptional 96.5% |
Demographics Similar to Immigrants from Ecuador by 7th Grade
In terms of 7th grade, the demographic groups most similar to Immigrants from Ecuador are Immigrants from Cambodia (93.7%, a difference of 0.030%), Immigrants from Cuba (93.8%, a difference of 0.080%), Immigrants from Vietnam (93.9%, a difference of 0.16%), Vietnamese (93.9%, a difference of 0.19%), and Immigrants from Fiji (93.5%, a difference of 0.21%).
| Demographics | Rating | Rank | 7th Grade |
| Puerto Ricans | 0.0 /100 | #311 | Tragic 94.0% |
| Immigrants | Immigrants | 0.0 /100 | #312 | Tragic 94.0% |
| Immigrants | Bangladesh | 0.0 /100 | #313 | Tragic 94.0% |
| Japanese | 0.0 /100 | #314 | Tragic 94.0% |
| Vietnamese | 0.0 /100 | #315 | Tragic 93.9% |
| Immigrants | Vietnam | 0.0 /100 | #316 | Tragic 93.9% |
| Immigrants | Cuba | 0.0 /100 | #317 | Tragic 93.8% |
| Immigrants | Ecuador | 0.0 /100 | #318 | Tragic 93.7% |
| Immigrants | Cambodia | 0.0 /100 | #319 | Tragic 93.7% |
| Immigrants | Fiji | 0.0 /100 | #320 | Tragic 93.5% |
| Belizeans | 0.0 /100 | #321 | Tragic 93.5% |
| Nicaraguans | 0.0 /100 | #322 | Tragic 93.5% |
| Immigrants | Belize | 0.0 /100 | #323 | Tragic 93.4% |
| Dominicans | 0.0 /100 | #324 | Tragic 93.3% |
| Central American Indians | 0.0 /100 | #325 | Tragic 93.3% |