Black/African American vs Immigrants from Brazil 3rd Grade
COMPARE
Black/African American
Immigrants from Brazil
3rd Grade
3rd Grade Comparison
Blacks/African Americans
Immigrants from Brazil
97.7%
3RD GRADE
29.6/ 100
METRIC RATING
191st/ 347
METRIC RANK
97.7%
3RD GRADE
46.4/ 100
METRIC RATING
178th/ 347
METRIC RANK
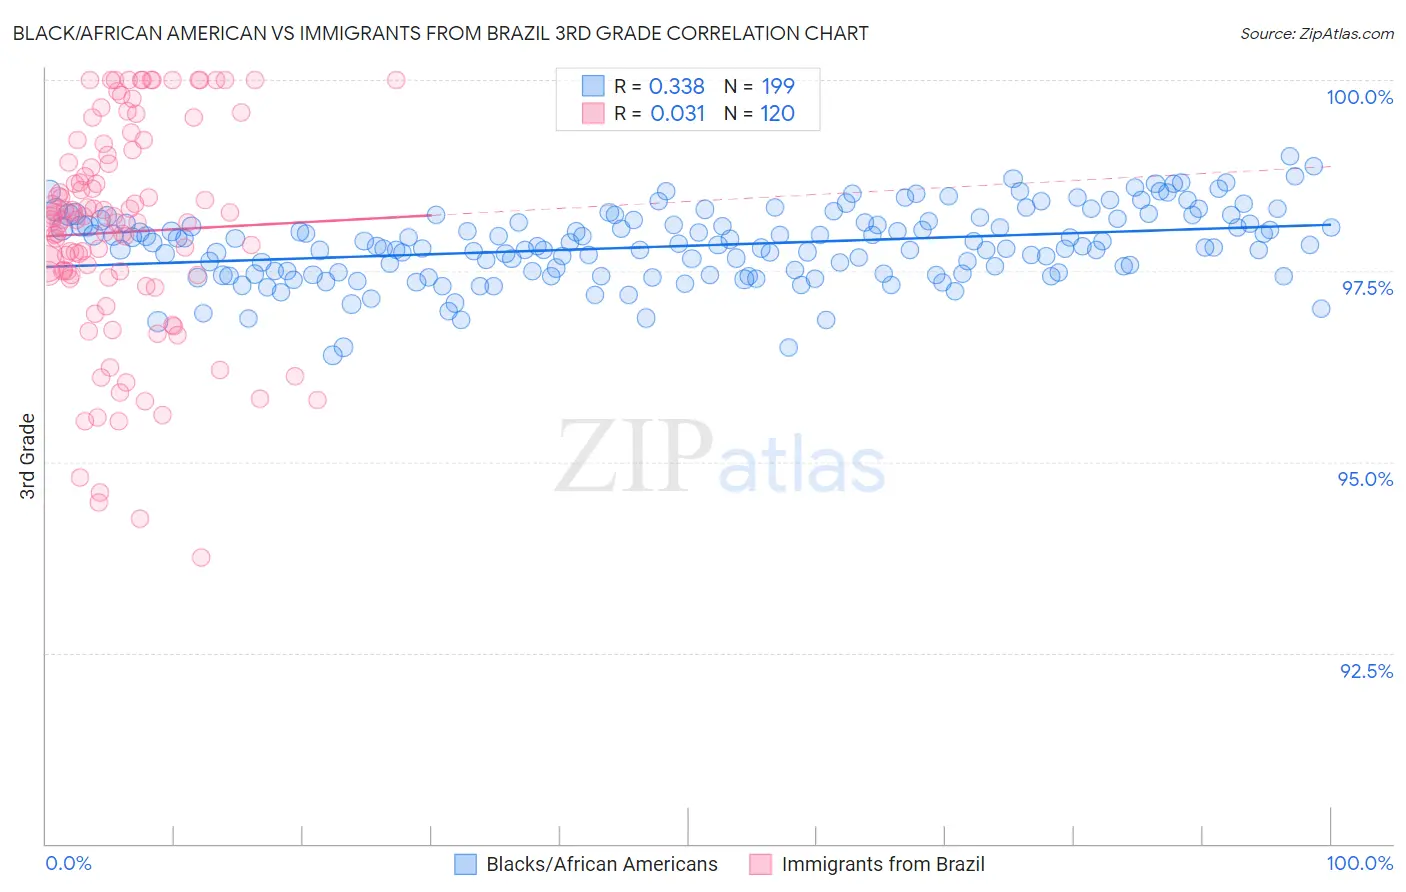
Black/African American vs Immigrants from Brazil 3rd Grade Correlation Chart
The statistical analysis conducted on geographies consisting of 566,043,750 people shows a mild positive correlation between the proportion of Blacks/African Americans and percentage of population with at least 3rd grade education in the United States with a correlation coefficient (R) of 0.338 and weighted average of 97.7%. Similarly, the statistical analysis conducted on geographies consisting of 343,021,580 people shows no correlation between the proportion of Immigrants from Brazil and percentage of population with at least 3rd grade education in the United States with a correlation coefficient (R) of 0.031 and weighted average of 97.7%, a difference of 0.060%.
3rd Grade Correlation Summary
| Measurement | Black/African American | Immigrants from Brazil |
| Minimum | 96.4% | 93.7% |
| Maximum | 99.0% | 100.0% |
| Range | 2.6% | 6.3% |
| Mean | 97.8% | 98.0% |
| Median | 97.8% | 98.2% |
| Interquartile 25% (IQ1) | 97.5% | 97.4% |
| Interquartile 75% (IQ3) | 98.1% | 99.0% |
| Interquartile Range (IQR) | 0.67% | 1.5% |
| Standard Deviation (Sample) | 0.47% | 1.4% |
| Standard Deviation (Population) | 0.47% | 1.4% |
Demographics Similar to Blacks/African Americans and Immigrants from Brazil by 3rd Grade
In terms of 3rd grade, the demographic groups most similar to Blacks/African Americans are Mongolian (97.7%, a difference of 0.0%), Panamanian (97.7%, a difference of 0.010%), Immigrants from Kenya (97.7%, a difference of 0.010%), Immigrants from Uganda (97.7%, a difference of 0.010%), and Native/Alaskan (97.7%, a difference of 0.020%). Similarly, the demographic groups most similar to Immigrants from Brazil are Immigrants from Micronesia (97.8%, a difference of 0.0%), Immigrants from Poland (97.8%, a difference of 0.0%), Egyptian (97.7%, a difference of 0.0%), Immigrants from Belarus (97.7%, a difference of 0.0%), and Immigrants from Sri Lanka (97.7%, a difference of 0.0%).
| Demographics | Rating | Rank | 3rd Grade |
| Navajo | 50.0 /100 | #174 | Average 97.8% |
| Immigrants | Micronesia | 47.6 /100 | #175 | Average 97.8% |
| Immigrants | Poland | 47.1 /100 | #176 | Average 97.8% |
| Egyptians | 46.6 /100 | #177 | Average 97.7% |
| Immigrants | Brazil | 46.4 /100 | #178 | Average 97.7% |
| Immigrants | Belarus | 45.9 /100 | #179 | Average 97.7% |
| Immigrants | Sri Lanka | 45.1 /100 | #180 | Average 97.7% |
| Immigrants | Venezuela | 44.4 /100 | #181 | Average 97.7% |
| Argentineans | 42.9 /100 | #182 | Average 97.7% |
| Arabs | 40.0 /100 | #183 | Fair 97.7% |
| Immigrants | Kazakhstan | 37.4 /100 | #184 | Fair 97.7% |
| Immigrants | Argentina | 37.0 /100 | #185 | Fair 97.7% |
| Portuguese | 36.2 /100 | #186 | Fair 97.7% |
| Natives/Alaskans | 35.2 /100 | #187 | Fair 97.7% |
| Immigrants | Taiwan | 34.2 /100 | #188 | Fair 97.7% |
| Pakistanis | 34.2 /100 | #189 | Fair 97.7% |
| Panamanians | 31.5 /100 | #190 | Fair 97.7% |
| Blacks/African Americans | 29.6 /100 | #191 | Fair 97.7% |
| Mongolians | 29.1 /100 | #192 | Fair 97.7% |
| Immigrants | Kenya | 28.2 /100 | #193 | Fair 97.7% |
| Immigrants | Uganda | 27.4 /100 | #194 | Fair 97.7% |