Swiss vs Immigrants from Caribbean 3rd Grade
COMPARE
Swiss
Immigrants from Caribbean
3rd Grade
3rd Grade Comparison
Swiss
Immigrants from Caribbean
98.4%
3RD GRADE
100.0/ 100
METRIC RATING
34th/ 347
METRIC RANK
96.7%
3RD GRADE
0.0/ 100
METRIC RATING
304th/ 347
METRIC RANK
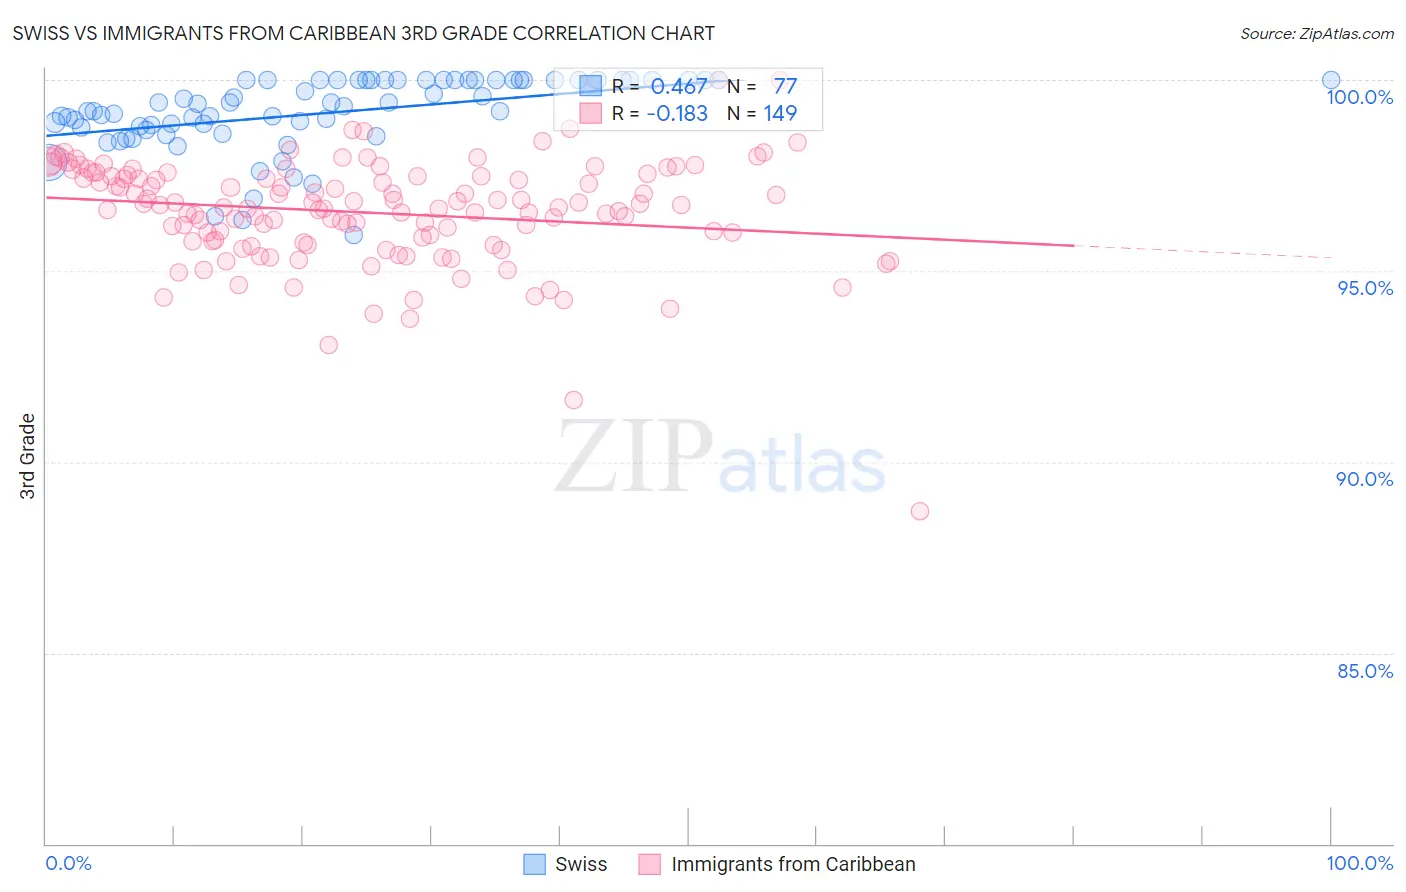
Swiss vs Immigrants from Caribbean 3rd Grade Correlation Chart
The statistical analysis conducted on geographies consisting of 465,023,158 people shows a moderate positive correlation between the proportion of Swiss and percentage of population with at least 3rd grade education in the United States with a correlation coefficient (R) of 0.467 and weighted average of 98.4%. Similarly, the statistical analysis conducted on geographies consisting of 450,065,262 people shows a poor negative correlation between the proportion of Immigrants from Caribbean and percentage of population with at least 3rd grade education in the United States with a correlation coefficient (R) of -0.183 and weighted average of 96.7%, a difference of 1.7%.
3rd Grade Correlation Summary
| Measurement | Swiss | Immigrants from Caribbean |
| Minimum | 95.9% | 88.7% |
| Maximum | 100.0% | 100.0% |
| Range | 4.1% | 11.3% |
| Mean | 99.1% | 96.5% |
| Median | 99.3% | 96.7% |
| Interquartile 25% (IQ1) | 98.7% | 95.8% |
| Interquartile 75% (IQ3) | 100.0% | 97.5% |
| Interquartile Range (IQR) | 1.3% | 1.7% |
| Standard Deviation (Sample) | 0.96% | 1.4% |
| Standard Deviation (Population) | 0.95% | 1.4% |
Similar Demographics by 3rd Grade
Demographics Similar to Swiss by 3rd Grade
In terms of 3rd grade, the demographic groups most similar to Swiss are Chinese (98.4%, a difference of 0.010%), Arapaho (98.4%, a difference of 0.010%), British (98.4%, a difference of 0.020%), Italian (98.4%, a difference of 0.020%), and Scandinavian (98.4%, a difference of 0.030%).
| Demographics | Rating | Rank | 3rd Grade |
| Croatians | 100.0 /100 | #27 | Exceptional 98.5% |
| French | 100.0 /100 | #28 | Exceptional 98.4% |
| French Canadians | 100.0 /100 | #29 | Exceptional 98.4% |
| Europeans | 100.0 /100 | #30 | Exceptional 98.4% |
| Czechs | 100.0 /100 | #31 | Exceptional 98.4% |
| Scandinavians | 100.0 /100 | #32 | Exceptional 98.4% |
| Chinese | 100.0 /100 | #33 | Exceptional 98.4% |
| Swiss | 100.0 /100 | #34 | Exceptional 98.4% |
| Arapaho | 100.0 /100 | #35 | Exceptional 98.4% |
| British | 99.9 /100 | #36 | Exceptional 98.4% |
| Italians | 99.9 /100 | #37 | Exceptional 98.4% |
| Chippewa | 99.9 /100 | #38 | Exceptional 98.4% |
| Latvians | 99.9 /100 | #39 | Exceptional 98.4% |
| Eastern Europeans | 99.9 /100 | #40 | Exceptional 98.3% |
| Luxembourgers | 99.9 /100 | #41 | Exceptional 98.3% |
Demographics Similar to Immigrants from Caribbean by 3rd Grade
In terms of 3rd grade, the demographic groups most similar to Immigrants from Caribbean are Central American Indian (96.7%, a difference of 0.010%), Immigrants from Somalia (96.8%, a difference of 0.020%), Ecuadorian (96.7%, a difference of 0.020%), Guyanese (96.7%, a difference of 0.040%), and Nicaraguan (96.7%, a difference of 0.060%).
| Demographics | Rating | Rank | 3rd Grade |
| Haitians | 0.0 /100 | #297 | Tragic 96.9% |
| Immigrants | Dominica | 0.0 /100 | #298 | Tragic 96.9% |
| Somalis | 0.0 /100 | #299 | Tragic 96.8% |
| Immigrants | South Eastern Asia | 0.0 /100 | #300 | Tragic 96.8% |
| Immigrants | Cuba | 0.0 /100 | #301 | Tragic 96.8% |
| Immigrants | Somalia | 0.0 /100 | #302 | Tragic 96.8% |
| Ecuadorians | 0.0 /100 | #303 | Tragic 96.7% |
| Immigrants | Caribbean | 0.0 /100 | #304 | Tragic 96.7% |
| Central American Indians | 0.0 /100 | #305 | Tragic 96.7% |
| Guyanese | 0.0 /100 | #306 | Tragic 96.7% |
| Nicaraguans | 0.0 /100 | #307 | Tragic 96.7% |
| Immigrants | Haiti | 0.0 /100 | #308 | Tragic 96.7% |
| Sri Lankans | 0.0 /100 | #309 | Tragic 96.7% |
| Cape Verdeans | 0.0 /100 | #310 | Tragic 96.6% |
| Immigrants | Guyana | 0.0 /100 | #311 | Tragic 96.6% |