Black/African American vs Icelander 3rd Grade
COMPARE
Black/African American
Icelander
3rd Grade
3rd Grade Comparison
Blacks/African Americans
Icelanders
97.7%
3RD GRADE
29.6/ 100
METRIC RATING
191st/ 347
METRIC RANK
98.1%
3RD GRADE
99.1/ 100
METRIC RATING
81st/ 347
METRIC RANK
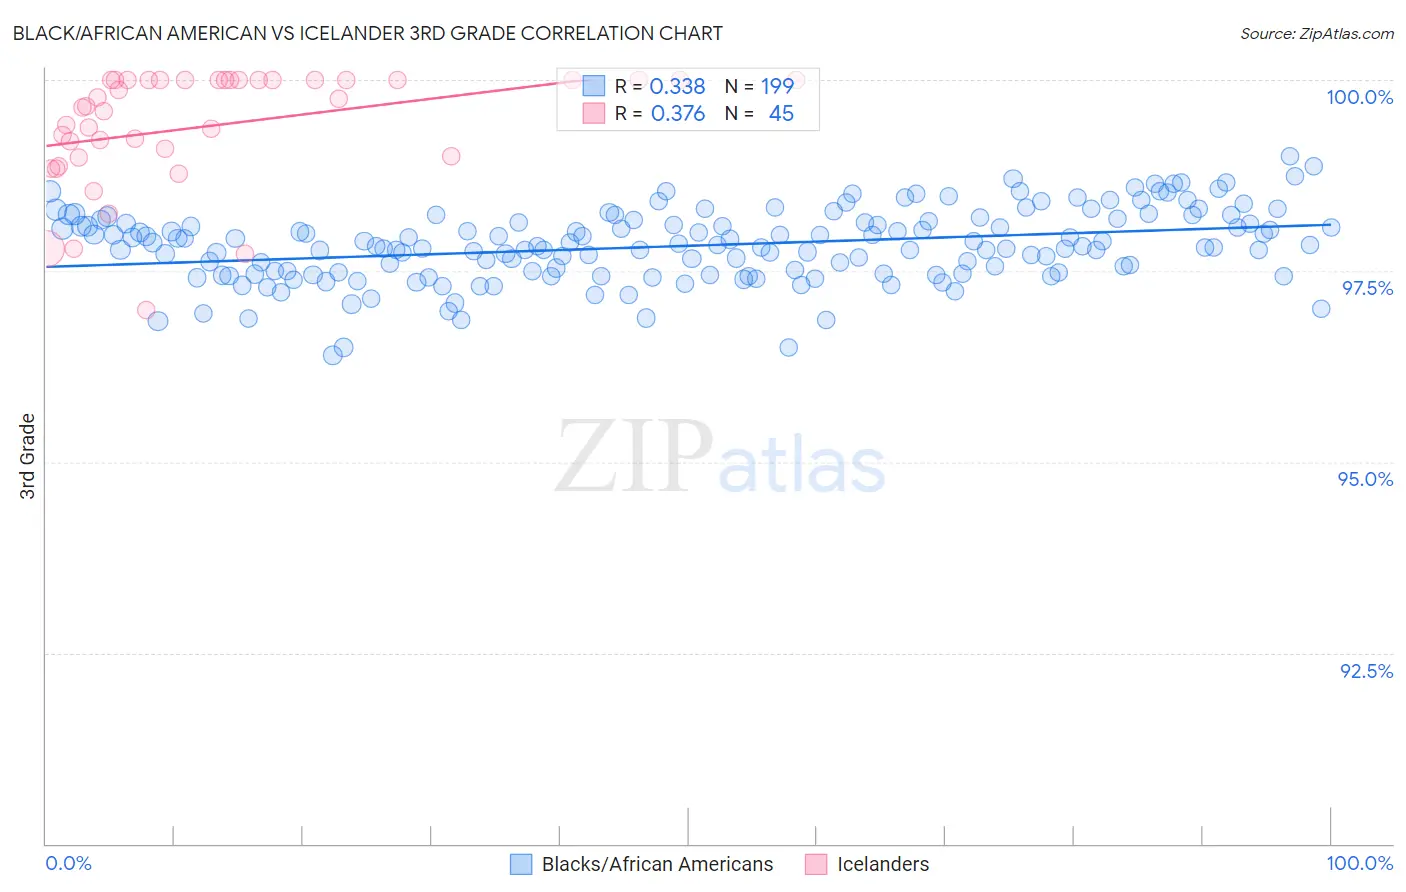
Black/African American vs Icelander 3rd Grade Correlation Chart
The statistical analysis conducted on geographies consisting of 566,043,750 people shows a mild positive correlation between the proportion of Blacks/African Americans and percentage of population with at least 3rd grade education in the United States with a correlation coefficient (R) of 0.338 and weighted average of 97.7%. Similarly, the statistical analysis conducted on geographies consisting of 159,668,748 people shows a mild positive correlation between the proportion of Icelanders and percentage of population with at least 3rd grade education in the United States with a correlation coefficient (R) of 0.376 and weighted average of 98.1%, a difference of 0.47%.
3rd Grade Correlation Summary
| Measurement | Black/African American | Icelander |
| Minimum | 96.4% | 97.0% |
| Maximum | 99.0% | 100.0% |
| Range | 2.6% | 3.0% |
| Mean | 97.8% | 99.4% |
| Median | 97.8% | 99.7% |
| Interquartile 25% (IQ1) | 97.5% | 99.0% |
| Interquartile 75% (IQ3) | 98.1% | 100.0% |
| Interquartile Range (IQR) | 0.67% | 1.0% |
| Standard Deviation (Sample) | 0.47% | 0.76% |
| Standard Deviation (Population) | 0.47% | 0.75% |
Similar Demographics by 3rd Grade
Demographics Similar to Blacks/African Americans by 3rd Grade
In terms of 3rd grade, the demographic groups most similar to Blacks/African Americans are Mongolian (97.7%, a difference of 0.0%), Panamanian (97.7%, a difference of 0.010%), Immigrants from Kenya (97.7%, a difference of 0.010%), Immigrants from Uganda (97.7%, a difference of 0.010%), and Immigrants from Egypt (97.7%, a difference of 0.010%).
| Demographics | Rating | Rank | 3rd Grade |
| Immigrants | Kazakhstan | 37.4 /100 | #184 | Fair 97.7% |
| Immigrants | Argentina | 37.0 /100 | #185 | Fair 97.7% |
| Portuguese | 36.2 /100 | #186 | Fair 97.7% |
| Natives/Alaskans | 35.2 /100 | #187 | Fair 97.7% |
| Immigrants | Taiwan | 34.2 /100 | #188 | Fair 97.7% |
| Pakistanis | 34.2 /100 | #189 | Fair 97.7% |
| Panamanians | 31.5 /100 | #190 | Fair 97.7% |
| Blacks/African Americans | 29.6 /100 | #191 | Fair 97.7% |
| Mongolians | 29.1 /100 | #192 | Fair 97.7% |
| Immigrants | Kenya | 28.2 /100 | #193 | Fair 97.7% |
| Immigrants | Uganda | 27.4 /100 | #194 | Fair 97.7% |
| Immigrants | Egypt | 26.8 /100 | #195 | Fair 97.7% |
| Paraguayans | 26.2 /100 | #196 | Fair 97.7% |
| Hawaiians | 25.7 /100 | #197 | Fair 97.7% |
| Guamanians/Chamorros | 23.6 /100 | #198 | Fair 97.7% |
Demographics Similar to Icelanders by 3rd Grade
In terms of 3rd grade, the demographic groups most similar to Icelanders are Immigrants from Belgium (98.1%, a difference of 0.0%), Macedonian (98.1%, a difference of 0.0%), Shoshone (98.1%, a difference of 0.0%), Osage (98.2%, a difference of 0.010%), and Ukrainian (98.1%, a difference of 0.010%).
| Demographics | Rating | Rank | 3rd Grade |
| Immigrants | Netherlands | 99.3 /100 | #74 | Exceptional 98.2% |
| Cherokee | 99.3 /100 | #75 | Exceptional 98.2% |
| Immigrants | England | 99.2 /100 | #76 | Exceptional 98.2% |
| Immigrants | Lithuania | 99.2 /100 | #77 | Exceptional 98.2% |
| Osage | 99.2 /100 | #78 | Exceptional 98.2% |
| Immigrants | Belgium | 99.1 /100 | #79 | Exceptional 98.1% |
| Macedonians | 99.1 /100 | #80 | Exceptional 98.1% |
| Icelanders | 99.1 /100 | #81 | Exceptional 98.1% |
| Shoshone | 99.0 /100 | #82 | Exceptional 98.1% |
| Ukrainians | 98.9 /100 | #83 | Exceptional 98.1% |
| Immigrants | Sweden | 98.9 /100 | #84 | Exceptional 98.1% |
| Immigrants | Australia | 98.9 /100 | #85 | Exceptional 98.1% |
| Potawatomi | 98.9 /100 | #86 | Exceptional 98.1% |
| Immigrants | Denmark | 98.8 /100 | #87 | Exceptional 98.1% |
| Immigrants | India | 98.8 /100 | #88 | Exceptional 98.1% |