Kiowa vs Immigrants from Caribbean 3rd Grade
COMPARE
Kiowa
Immigrants from Caribbean
3rd Grade
3rd Grade Comparison
Kiowa
Immigrants from Caribbean
98.2%
3RD GRADE
99.6/ 100
METRIC RATING
64th/ 347
METRIC RANK
96.7%
3RD GRADE
0.0/ 100
METRIC RATING
304th/ 347
METRIC RANK
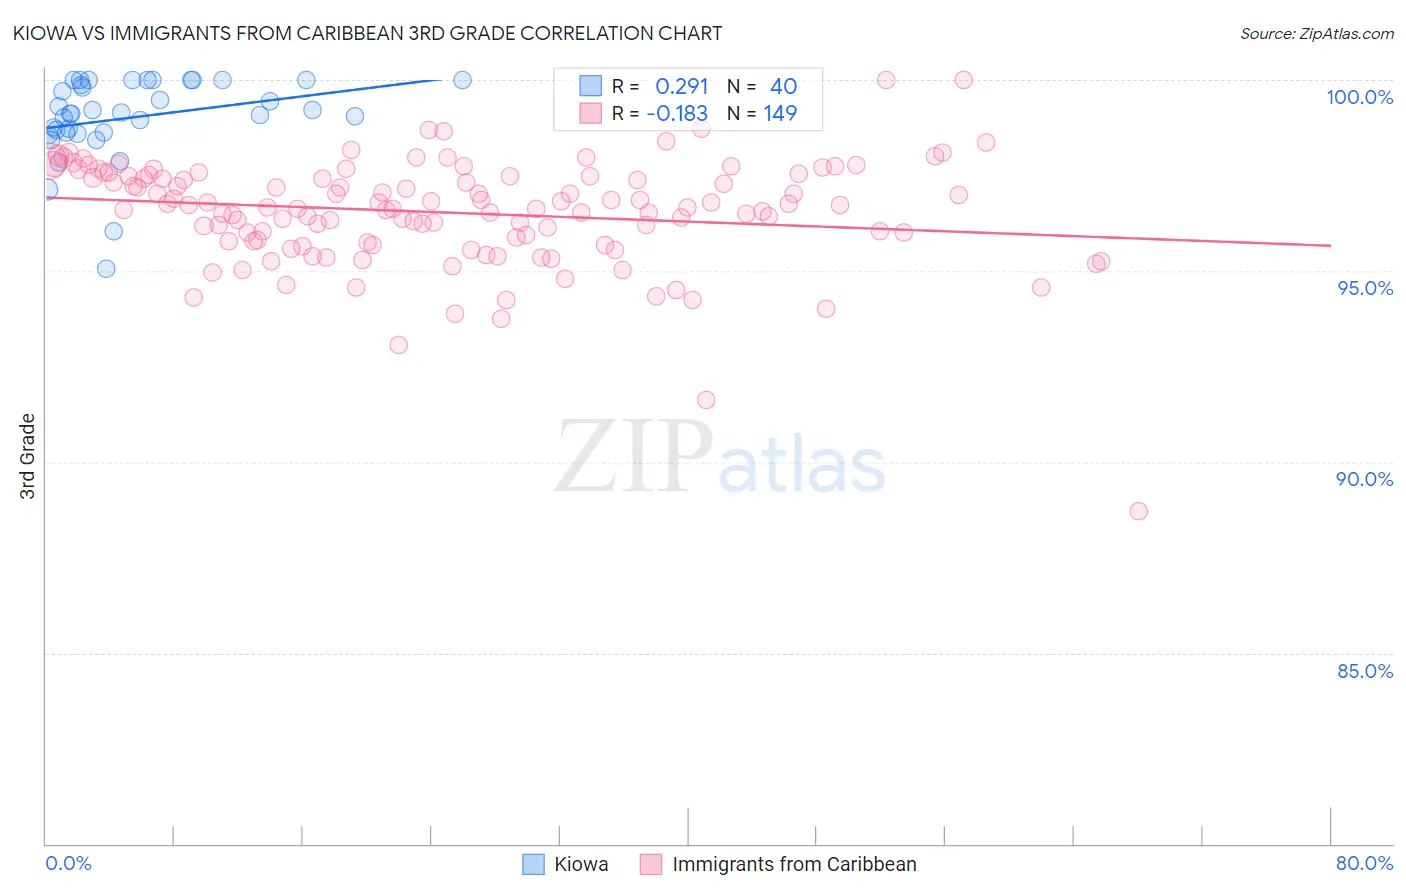
Kiowa vs Immigrants from Caribbean 3rd Grade Correlation Chart
The statistical analysis conducted on geographies consisting of 56,100,633 people shows a weak positive correlation between the proportion of Kiowa and percentage of population with at least 3rd grade education in the United States with a correlation coefficient (R) of 0.291 and weighted average of 98.2%. Similarly, the statistical analysis conducted on geographies consisting of 450,065,262 people shows a poor negative correlation between the proportion of Immigrants from Caribbean and percentage of population with at least 3rd grade education in the United States with a correlation coefficient (R) of -0.183 and weighted average of 96.7%, a difference of 1.5%.
3rd Grade Correlation Summary
| Measurement | Kiowa | Immigrants from Caribbean |
| Minimum | 95.0% | 88.7% |
| Maximum | 100.0% | 100.0% |
| Range | 5.0% | 11.3% |
| Mean | 99.0% | 96.5% |
| Median | 99.1% | 96.7% |
| Interquartile 25% (IQ1) | 98.6% | 95.8% |
| Interquartile 75% (IQ3) | 100.0% | 97.5% |
| Interquartile Range (IQR) | 1.4% | 1.7% |
| Standard Deviation (Sample) | 1.1% | 1.4% |
| Standard Deviation (Population) | 1.1% | 1.4% |
Similar Demographics by 3rd Grade
Demographics Similar to Kiowa by 3rd Grade
In terms of 3rd grade, the demographic groups most similar to Kiowa are New Zealander (98.2%, a difference of 0.0%), Immigrants from North America (98.2%, a difference of 0.010%), Serbian (98.2%, a difference of 0.010%), Russian (98.2%, a difference of 0.010%), and Immigrants from Northern Europe (98.2%, a difference of 0.010%).
| Demographics | Rating | Rank | 3rd Grade |
| Slavs | 99.7 /100 | #57 | Exceptional 98.3% |
| Greeks | 99.7 /100 | #58 | Exceptional 98.3% |
| Maltese | 99.7 /100 | #59 | Exceptional 98.3% |
| Creek | 99.7 /100 | #60 | Exceptional 98.2% |
| Pueblo | 99.7 /100 | #61 | Exceptional 98.2% |
| Immigrants | Canada | 99.7 /100 | #62 | Exceptional 98.2% |
| Immigrants | North America | 99.7 /100 | #63 | Exceptional 98.2% |
| Kiowa | 99.6 /100 | #64 | Exceptional 98.2% |
| New Zealanders | 99.6 /100 | #65 | Exceptional 98.2% |
| Serbians | 99.6 /100 | #66 | Exceptional 98.2% |
| Russians | 99.6 /100 | #67 | Exceptional 98.2% |
| Immigrants | Northern Europe | 99.6 /100 | #68 | Exceptional 98.2% |
| Canadians | 99.6 /100 | #69 | Exceptional 98.2% |
| Cajuns | 99.6 /100 | #70 | Exceptional 98.2% |
| Immigrants | Austria | 99.6 /100 | #71 | Exceptional 98.2% |
Demographics Similar to Immigrants from Caribbean by 3rd Grade
In terms of 3rd grade, the demographic groups most similar to Immigrants from Caribbean are Central American Indian (96.7%, a difference of 0.010%), Immigrants from Somalia (96.8%, a difference of 0.020%), Ecuadorian (96.7%, a difference of 0.020%), Guyanese (96.7%, a difference of 0.040%), and Nicaraguan (96.7%, a difference of 0.060%).
| Demographics | Rating | Rank | 3rd Grade |
| Haitians | 0.0 /100 | #297 | Tragic 96.9% |
| Immigrants | Dominica | 0.0 /100 | #298 | Tragic 96.9% |
| Somalis | 0.0 /100 | #299 | Tragic 96.8% |
| Immigrants | South Eastern Asia | 0.0 /100 | #300 | Tragic 96.8% |
| Immigrants | Cuba | 0.0 /100 | #301 | Tragic 96.8% |
| Immigrants | Somalia | 0.0 /100 | #302 | Tragic 96.8% |
| Ecuadorians | 0.0 /100 | #303 | Tragic 96.7% |
| Immigrants | Caribbean | 0.0 /100 | #304 | Tragic 96.7% |
| Central American Indians | 0.0 /100 | #305 | Tragic 96.7% |
| Guyanese | 0.0 /100 | #306 | Tragic 96.7% |
| Nicaraguans | 0.0 /100 | #307 | Tragic 96.7% |
| Immigrants | Haiti | 0.0 /100 | #308 | Tragic 96.7% |
| Sri Lankans | 0.0 /100 | #309 | Tragic 96.7% |
| Cape Verdeans | 0.0 /100 | #310 | Tragic 96.6% |
| Immigrants | Guyana | 0.0 /100 | #311 | Tragic 96.6% |