Blackfeet vs Malaysian Doctorate Degree
COMPARE
Blackfeet
Malaysian
Doctorate Degree
Doctorate Degree Comparison
Blackfeet
Malaysians
1.5%
DOCTORATE DEGREE
0.7/ 100
METRIC RATING
264th/ 347
METRIC RANK
1.5%
DOCTORATE DEGREE
0.3/ 100
METRIC RATING
285th/ 347
METRIC RANK
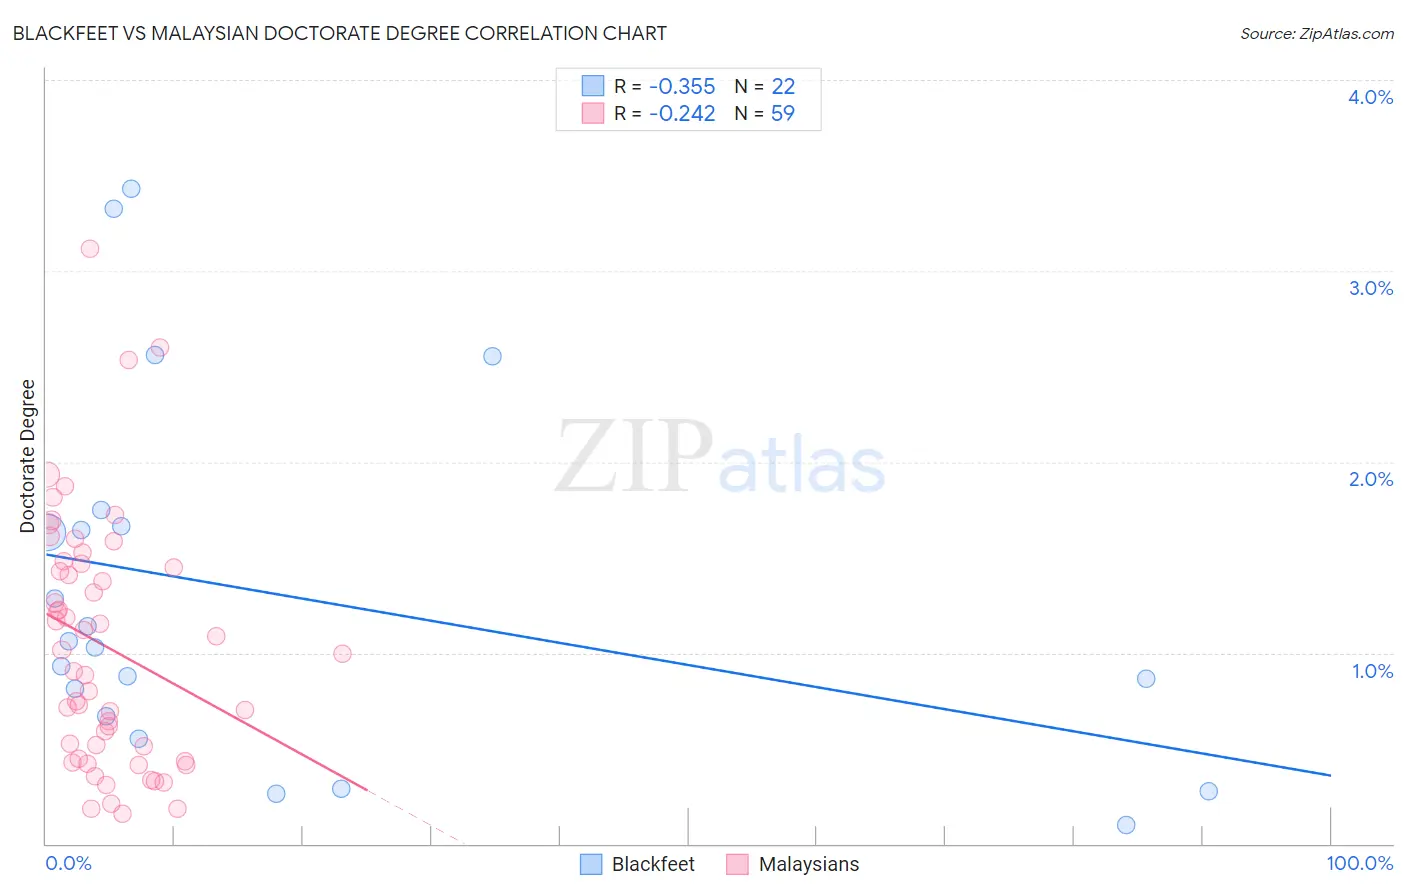
Blackfeet vs Malaysian Doctorate Degree Correlation Chart
The statistical analysis conducted on geographies consisting of 304,903,722 people shows a mild negative correlation between the proportion of Blackfeet and percentage of population with at least doctorate degree education in the United States with a correlation coefficient (R) of -0.355 and weighted average of 1.5%. Similarly, the statistical analysis conducted on geographies consisting of 224,756,978 people shows a weak negative correlation between the proportion of Malaysians and percentage of population with at least doctorate degree education in the United States with a correlation coefficient (R) of -0.242 and weighted average of 1.5%, a difference of 3.3%.
Doctorate Degree Correlation Summary
| Measurement | Blackfeet | Malaysian |
| Minimum | 0.095% | 0.16% |
| Maximum | 3.4% | 3.1% |
| Range | 3.3% | 3.0% |
| Mean | 1.3% | 1.0% |
| Median | 1.0% | 1.00% |
| Interquartile 25% (IQ1) | 0.67% | 0.45% |
| Interquartile 75% (IQ3) | 1.7% | 1.5% |
| Interquartile Range (IQR) | 1.00% | 1.0% |
| Standard Deviation (Sample) | 0.95% | 0.65% |
| Standard Deviation (Population) | 0.93% | 0.64% |
Similar Demographics by Doctorate Degree
Demographics Similar to Blackfeet by Doctorate Degree
In terms of doctorate degree, the demographic groups most similar to Blackfeet are Immigrants from Bahamas (1.5%, a difference of 0.18%), Nicaraguan (1.5%, a difference of 0.28%), Chickasaw (1.5%, a difference of 0.36%), Immigrants from Portugal (1.5%, a difference of 0.51%), and Japanese (1.5%, a difference of 0.97%).
| Demographics | Rating | Rank | Doctorate Degree |
| Chippewa | 0.9 /100 | #257 | Tragic 1.5% |
| Immigrants | West Indies | 0.9 /100 | #258 | Tragic 1.5% |
| Liberians | 0.9 /100 | #259 | Tragic 1.5% |
| Japanese | 0.9 /100 | #260 | Tragic 1.5% |
| Immigrants | Portugal | 0.8 /100 | #261 | Tragic 1.5% |
| Chickasaw | 0.7 /100 | #262 | Tragic 1.5% |
| Immigrants | Bahamas | 0.7 /100 | #263 | Tragic 1.5% |
| Blackfeet | 0.7 /100 | #264 | Tragic 1.5% |
| Nicaraguans | 0.6 /100 | #265 | Tragic 1.5% |
| Immigrants | Liberia | 0.5 /100 | #266 | Tragic 1.5% |
| Kiowa | 0.5 /100 | #267 | Tragic 1.5% |
| U.S. Virgin Islanders | 0.5 /100 | #268 | Tragic 1.5% |
| Crow | 0.5 /100 | #269 | Tragic 1.5% |
| Salvadorans | 0.5 /100 | #270 | Tragic 1.5% |
| Immigrants | Trinidad and Tobago | 0.5 /100 | #271 | Tragic 1.5% |
Demographics Similar to Malaysians by Doctorate Degree
In terms of doctorate degree, the demographic groups most similar to Malaysians are Jamaican (1.5%, a difference of 0.030%), Central American (1.5%, a difference of 0.070%), British West Indian (1.5%, a difference of 0.11%), Tohono O'odham (1.5%, a difference of 0.17%), and Cherokee (1.5%, a difference of 0.18%).
| Demographics | Rating | Rank | Doctorate Degree |
| Hawaiians | 0.4 /100 | #278 | Tragic 1.5% |
| Marshallese | 0.4 /100 | #279 | Tragic 1.5% |
| Ecuadorians | 0.4 /100 | #280 | Tragic 1.5% |
| Tohono O'odham | 0.4 /100 | #281 | Tragic 1.5% |
| British West Indians | 0.3 /100 | #282 | Tragic 1.5% |
| Central Americans | 0.3 /100 | #283 | Tragic 1.5% |
| Jamaicans | 0.3 /100 | #284 | Tragic 1.5% |
| Malaysians | 0.3 /100 | #285 | Tragic 1.5% |
| Cherokee | 0.3 /100 | #286 | Tragic 1.5% |
| Cajuns | 0.3 /100 | #287 | Tragic 1.5% |
| Immigrants | El Salvador | 0.3 /100 | #288 | Tragic 1.4% |
| Cape Verdeans | 0.3 /100 | #289 | Tragic 1.4% |
| Choctaw | 0.3 /100 | #290 | Tragic 1.4% |
| Blacks/African Americans | 0.3 /100 | #291 | Tragic 1.4% |
| Alaska Natives | 0.3 /100 | #292 | Tragic 1.4% |