Blackfeet vs Immigrants from Ukraine Doctorate Degree

COMPARE

Blackfeet
Race
Ancestry
AfghanAfricanAlaska NativeAlaskan AthabascanAlbanianAleutAlsatianAmericanApacheArabArapahoArgentineanArmenianAssyrian/Chaldean/SyriacAustralianAustrianBahamianBangladeshiBarbadianBasqueBelgianBelizeanBermudanBhutaneseBlackfeetBolivianBrazilianBritishBritish West IndianBulgarianBurmeseCajunCambodianCanadianCape VerdeanCarpatho RusynCelticCentral AmericanCentral American IndianCherokeeCheyenneChickasawChileanChineseChippewaChoctawColombianColvilleComancheCosta RicanCreeCreekCroatianCrowCubanCypriotCzechCzechoslovakianDanishDelawareDominicanDutchDutch West IndianEastern EuropeanEcuadorianEgyptianEnglishEstonianEthiopianEuropeanFijianFilipinoFinnishFrenchFrench American IndianFrench CanadianGermanGerman RussianGhanaianGreekGuamanian/ChamorroGuatemalanGuyaneseHaitianHmongHonduranHopiHoumaHungarianIcelanderIndian (Asian)IndonesianInupiatIranianIraqiIrishIroquoisIsraeliItalianJamaicanJapaneseJordanianKenyanKiowaKoreanLaotianLatvianLebaneseLiberianLithuanianLumbeeLuxembourgerMacedonianMalaysianMalteseMarshalleseMenomineeMexicanMexican American IndianMongolianMoroccanNative HawaiianNavajoNepaleseNew ZealanderNicaraguanNigerianNorthern EuropeanNorwegianOkinawanOsageOttawaPaiutePakistaniPalestinianPanamanianParaguayanPennsylvania GermanPeruvianPimaPolishPortuguesePotawatomiPuebloPuerto RicanPuget Sound SalishRomanianRussianSalvadoranSamoanScandinavianScotch-IrishScottishSeminoleSenegaleseSerbianShoshoneSierra LeoneanSiouxSlavicSlovakSloveneSomaliSouth AfricanSouth AmericanSouth American IndianSoviet UnionSpaniardSpanishSpanish AmericanSpanish American IndianSri LankanSubsaharan AfricanSudaneseSwedishSwissSyrianTaiwaneseThaiTlingit-HaidaTohono O'OdhamTonganTrinidadian and TobagonianTsimshianTurkishU.S. Virgin IslanderUgandanUkrainianUruguayanUteVenezuelanVietnameseWelshWest IndianYakamaYaquiYugoslavianYumanYup'ikZimbabwean
Immigration
NonimmigrantsImmigrantsAfghanistanAfricaAlbaniaArgentinaArmeniaAsiaAustraliaAustriaBahamasBangladeshBarbadosBelarusBelgiumBelizeBoliviaBosnia and HerzegovinaBrazilBulgariaBurma/MyanmarCabo VerdeCambodiaCameroonCanadaCaribbeanCentral AmericaChileChinaColombiaCongoCosta RicaCroatiaCubaCzechoslovakiaDenmarkDominicaDominican RepublicEastern AfricaEastern AsiaEastern EuropeEcuadorEgyptEl SalvadorEnglandEritreaEthiopiaEuropeFijiFranceGermanyGhanaGreeceGrenadaGuatemalaGuyanaHaitiHondurasHong KongHungaryIndiaIndonesiaIranIraqIrelandIsraelItalyJamaicaJapanJordanKazakhstanKenyaKoreaKuwaitLaosLatin AmericaLatviaLebanonLiberiaLithuaniaMalaysiaMexicoMicronesiaMiddle AfricaMoldovaMoroccoNepalNetherlandsNicaraguaNigeriaNorth AmericaNorth MacedoniaNorthern AfricaNorthern EuropeNorwayOceaniaPakistanPanamaPeruPhilippinesPolandPortugalRomaniaRussiaSaudi ArabiaScotlandSenegalSerbiaSierra LeoneSingaporeSomaliaSouth AfricaSouth AmericaSouth Central AsiaSouth Eastern AsiaSouthern EuropeSpainSri LankaSt. Vincent and the GrenadinesSudanSwedenSwitzerlandSyriaTaiwanThailandTrinidad and TobagoTurkeyUgandaUruguayUzbekistanVenezuelaVietnamWest IndiesWestern AfricaWestern AsiaWestern EuropeYemenZaireZimbabweAzores
Immigrants from Ukraine
Race
Ancestry
AfghanAfricanAlaska NativeAlaskan AthabascanAlbanianAleutAlsatianAmericanApacheArabArapahoArgentineanArmenianAssyrian/Chaldean/SyriacAustralianAustrianBahamianBangladeshiBarbadianBasqueBelgianBelizeanBermudanBhutaneseBolivianBrazilianBritishBritish West IndianBulgarianBurmeseCajunCambodianCanadianCape VerdeanCarpatho RusynCelticCentral AmericanCentral American IndianCherokeeCheyenneChickasawChileanChineseChippewaChoctawColombianColvilleComancheCosta RicanCreeCreekCroatianCrowCubanCypriotCzechCzechoslovakianDanishDelawareDominicanDutchDutch West IndianEastern EuropeanEcuadorianEgyptianEnglishEstonianEthiopianEuropeanFijianFilipinoFinnishFrenchFrench American IndianFrench CanadianGermanGerman RussianGhanaianGreekGuamanian/ChamorroGuatemalanGuyaneseHaitianHmongHonduranHopiHoumaHungarianIcelanderIndian (Asian)IndonesianInupiatIranianIraqiIrishIroquoisIsraeliItalianJamaicanJapaneseJordanianKenyanKiowaKoreanLaotianLatvianLebaneseLiberianLithuanianLumbeeLuxembourgerMacedonianMalaysianMalteseMarshalleseMenomineeMexicanMexican American IndianMongolianMoroccanNative HawaiianNavajoNepaleseNew ZealanderNicaraguanNigerianNorthern EuropeanNorwegianOkinawanOsageOttawaPaiutePakistaniPalestinianPanamanianParaguayanPennsylvania GermanPeruvianPimaPolishPortuguesePotawatomiPuebloPuerto RicanPuget Sound SalishRomanianRussianSalvadoranSamoanScandinavianScotch-IrishScottishSeminoleSenegaleseSerbianShoshoneSierra LeoneanSiouxSlavicSlovakSloveneSomaliSouth AfricanSouth AmericanSouth American IndianSoviet UnionSpaniardSpanishSpanish AmericanSpanish American IndianSri LankanSubsaharan AfricanSudaneseSwedishSwissSyrianTaiwaneseThaiTlingit-HaidaTohono O'OdhamTonganTrinidadian and TobagonianTsimshianTurkishU.S. Virgin IslanderUgandanUkrainianUruguayanUteVenezuelanVietnameseWelshWest IndianYakamaYaquiYugoslavianYumanYup'ikZimbabwean
Immigration
NonimmigrantsImmigrantsAfghanistanAfricaAlbaniaArgentinaArmeniaAsiaAustraliaAustriaBahamasBangladeshBarbadosBelarusBelgiumBelizeBoliviaBosnia and HerzegovinaBrazilBulgariaBurma/MyanmarCabo VerdeCambodiaCameroonCanadaCaribbeanCentral AmericaChileChinaColombiaCongoCosta RicaCroatiaCubaCzechoslovakiaDenmarkDominicaDominican RepublicEastern AfricaEastern AsiaEastern EuropeEcuadorEgyptEl SalvadorEnglandEritreaEthiopiaEuropeFijiFranceGermanyGhanaGreeceGrenadaGuatemalaGuyanaHaitiHondurasHong KongHungaryIndiaIndonesiaIranIraqIrelandIsraelItalyJamaicaJapanJordanKazakhstanKenyaKoreaKuwaitLaosLatin AmericaLatviaLebanonLiberiaLithuaniaMalaysiaMexicoMicronesiaMiddle AfricaMoldovaMoroccoNepalNetherlandsNicaraguaNigeriaNorth AmericaNorth MacedoniaNorthern AfricaNorthern EuropeNorwayOceaniaPakistanPanamaPeruPhilippinesPolandPortugalRomaniaRussiaSaudi ArabiaScotlandSenegalSerbiaSierra LeoneSingaporeSomaliaSouth AfricaSouth AmericaSouth Central AsiaSouth Eastern AsiaSouthern EuropeSpainSri LankaSt. Vincent and the GrenadinesSudanSwedenSwitzerlandSyriaTaiwanThailandTrinidad and TobagoTurkeyUgandaUkraineUruguayUzbekistanVenezuelaVietnamWest IndiesWestern AfricaWestern AsiaWestern EuropeYemenZaireZimbabweAzores
Doctorate Degree
Income
Poverty
Unemployment
Labor Participation
Family Structure
Vehicle Availability
Education Level
Disability

Doctorate Degree Comparison

Blackfeet

Immigrants from Ukraine

Tragic
Exceptional
1.5%
DOCTORATE DEGREE
0.7/ 100
METRIC RATING
264th/ 347
METRIC RANK
2.0%
DOCTORATE DEGREE
90.5/ 100
METRIC RATING
130th/ 347
METRIC RANK

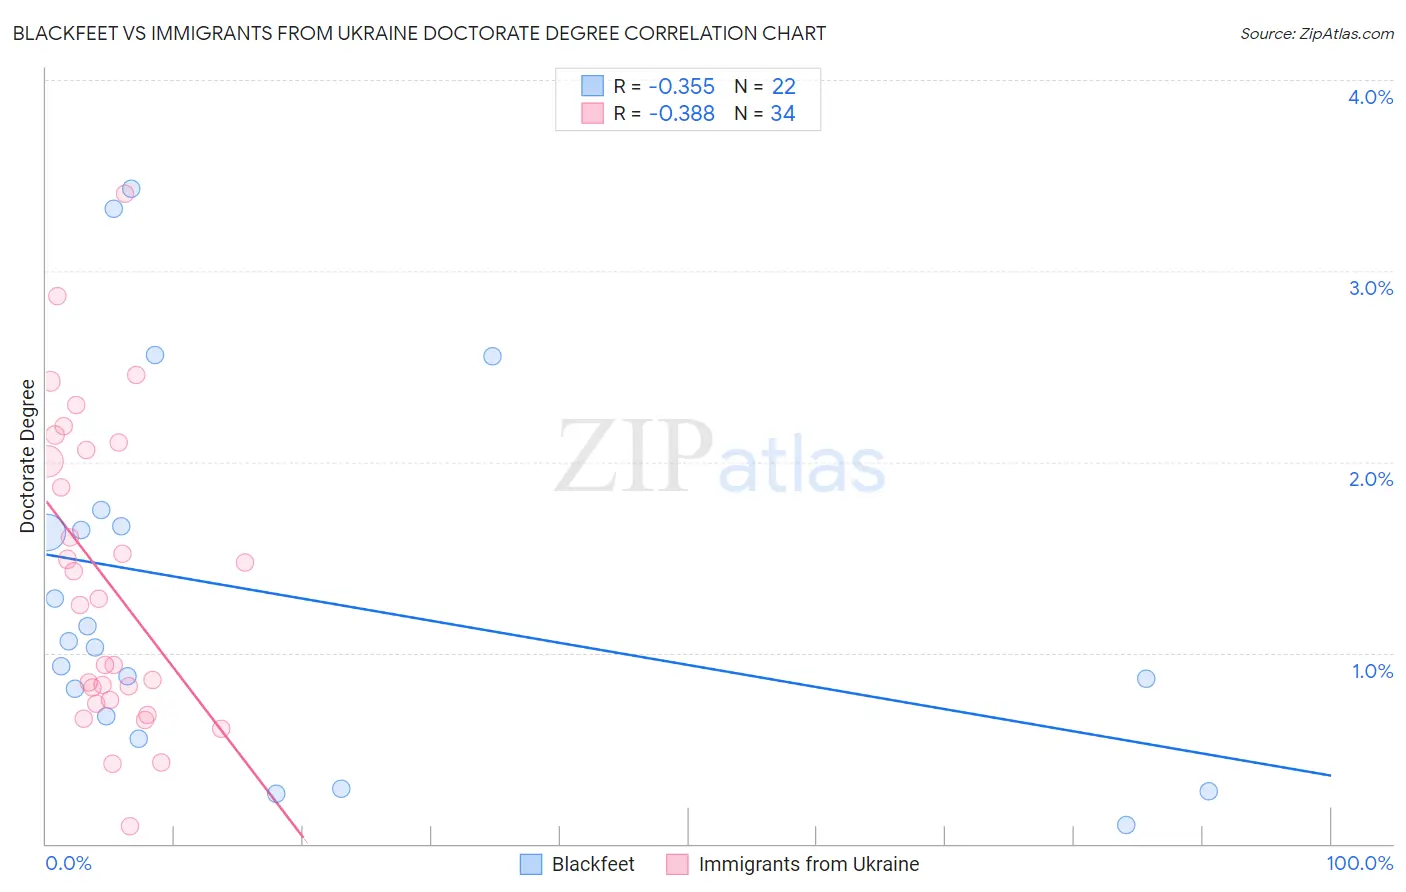
Blackfeet vs Immigrants from Ukraine Doctorate Degree Correlation Chart

The statistical analysis conducted on geographies consisting of 304,903,722 people shows a mild negative correlation between the proportion of Blackfeet and percentage of population with at least doctorate degree education in the United States with a correlation coefficient (R) of -0.355 and weighted average of 1.5%. Similarly, the statistical analysis conducted on geographies consisting of 288,420,787 people shows a mild negative correlation between the proportion of Immigrants from Ukraine and percentage of population with at least doctorate degree education in the United States with a correlation coefficient (R) of -0.388 and weighted average of 2.0%, a difference of 32.4%.
Blackfeet vs Immigrants from Ukraine Doctorate Degree

Doctorate Degree Correlation Summary

MeasurementBlackfeetImmigrants from Ukraine
Minimum0.095%0.095%
Maximum3.4%3.4%
Range3.3%3.3%
Mean1.3%1.4%
Median1.0%1.3%
Interquartile 25% (IQ1)0.67%0.75%
Interquartile 75% (IQ3)1.7%2.1%
Interquartile Range (IQR)1.00%1.3%
Standard Deviation (Sample)0.95%0.79%
Standard Deviation (Population)0.93%0.78%

Similar Demographics by Doctorate Degree

Demographics Similar to Blackfeet by Doctorate Degree

In terms of doctorate degree, the demographic groups most similar to Blackfeet are Immigrants from Bahamas (1.5%, a difference of 0.18%), Nicaraguan (1.5%, a difference of 0.28%), Chickasaw (1.5%, a difference of 0.36%), Immigrants from Portugal (1.5%, a difference of 0.51%), and Japanese (1.5%, a difference of 0.97%).
DemographicsRating | RankDoctorate Degree
Chippewa
0.9
/100
|
#257
Tragic
1.5%
Immigrants | West Indies
0.9
/100
|
#258
Tragic
1.5%
Liberians
0.9
/100
|
#259
Tragic
1.5%
Japanese
0.9
/100
|
#260
Tragic
1.5%
Immigrants | Portugal
0.8
/100
|
#261
Tragic
1.5%
Chickasaw
0.7
/100
|
#262
Tragic
1.5%
Immigrants | Bahamas
0.7
/100
|
#263
Tragic
1.5%
Blackfeet
0.7
/100
|
#264
Tragic
1.5%
Nicaraguans
0.6
/100
|
#265
Tragic
1.5%
Immigrants | Liberia
0.5
/100
|
#266
Tragic
1.5%
Kiowa
0.5
/100
|
#267
Tragic
1.5%
U.S. Virgin Islanders
0.5
/100
|
#268
Tragic
1.5%
Crow
0.5
/100
|
#269
Tragic
1.5%
Salvadorans
0.5
/100
|
#270
Tragic
1.5%
Immigrants | Trinidad and Tobago
0.5
/100
|
#271
Tragic
1.5%

Demographics Similar to Immigrants from Ukraine by Doctorate Degree

In terms of doctorate degree, the demographic groups most similar to Immigrants from Ukraine are Canadian (2.0%, a difference of 0.010%), Immigrants from Sierra Leone (2.0%, a difference of 0.14%), Immigrants from Zaire (2.0%, a difference of 0.22%), Scottish (2.0%, a difference of 0.41%), and Immigrants from Uzbekistan (2.0%, a difference of 0.46%).
DemographicsRating | RankDoctorate Degree
Croatians
94.0
/100
|
#123
Exceptional
2.0%
Ute
93.2
/100
|
#124
Exceptional
2.0%
Moroccans
93.0
/100
|
#125
Exceptional
2.0%
Jordanians
92.1
/100
|
#126
Exceptional
2.0%
Palestinians
92.0
/100
|
#127
Exceptional
2.0%
Immigrants | Zaire
91.1
/100
|
#128
Exceptional
2.0%
Canadians
90.6
/100
|
#129
Exceptional
2.0%
Immigrants | Ukraine
90.5
/100
|
#130
Exceptional
2.0%
Immigrants | Sierra Leone
90.2
/100
|
#131
Exceptional
2.0%
Scottish
89.4
/100
|
#132
Excellent
2.0%
Immigrants | Uzbekistan
89.3
/100
|
#133
Excellent
2.0%
Immigrants | Cameroon
88.9
/100
|
#134
Excellent
2.0%
Serbians
88.7
/100
|
#135
Excellent
2.0%
Swedes
88.3
/100
|
#136
Excellent
2.0%
South American Indians
88.3
/100
|
#137
Excellent
2.0%