Creek vs Immigrants from Denmark Master's Degree
COMPARE
Creek
Immigrants from Denmark
Master's Degree
Master's Degree Comparison
Creek
Immigrants from Denmark
10.5%
MASTER'S DEGREE
0.0/ 100
METRIC RATING
326th/ 347
METRIC RANK
19.5%
MASTER'S DEGREE
100.0/ 100
METRIC RATING
34th/ 347
METRIC RANK
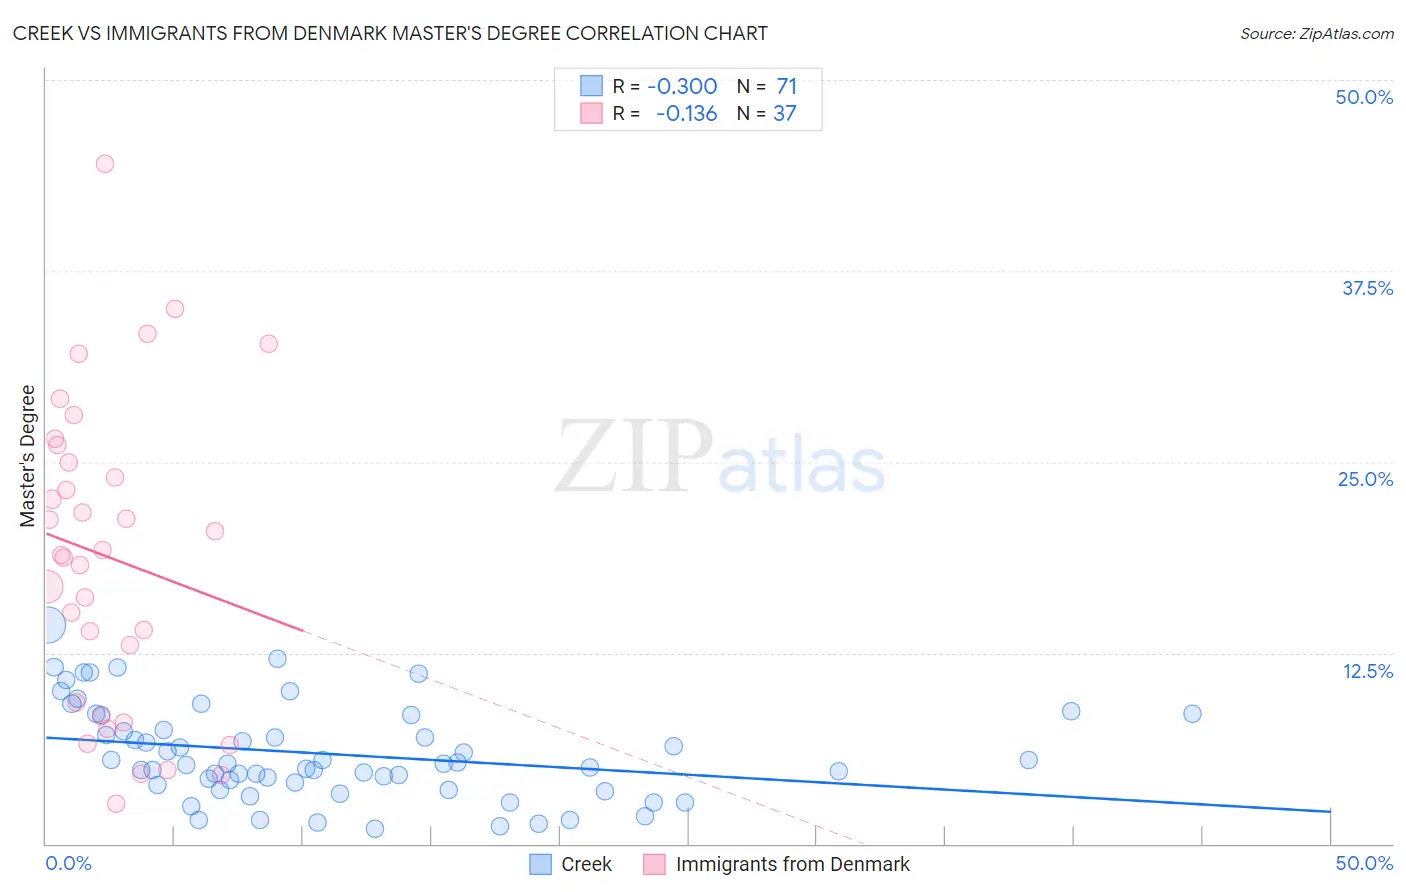
Creek vs Immigrants from Denmark Master's Degree Correlation Chart
The statistical analysis conducted on geographies consisting of 178,384,928 people shows a weak negative correlation between the proportion of Creek and percentage of population with at least master's degree education in the United States with a correlation coefficient (R) of -0.300 and weighted average of 10.5%. Similarly, the statistical analysis conducted on geographies consisting of 136,426,829 people shows a poor negative correlation between the proportion of Immigrants from Denmark and percentage of population with at least master's degree education in the United States with a correlation coefficient (R) of -0.136 and weighted average of 19.5%, a difference of 85.9%.
Master's Degree Correlation Summary
| Measurement | Creek | Immigrants from Denmark |
| Minimum | 0.96% | 2.7% |
| Maximum | 14.3% | 44.5% |
| Range | 13.3% | 41.9% |
| Mean | 5.9% | 18.7% |
| Median | 5.2% | 18.9% |
| Interquartile 25% (IQ1) | 3.9% | 8.8% |
| Interquartile 75% (IQ3) | 8.4% | 25.5% |
| Interquartile Range (IQR) | 4.5% | 16.7% |
| Standard Deviation (Sample) | 3.1% | 10.1% |
| Standard Deviation (Population) | 3.1% | 9.9% |
Similar Demographics by Master's Degree
Demographics Similar to Creek by Master's Degree
In terms of master's degree, the demographic groups most similar to Creek are Inupiat (10.5%, a difference of 0.0%), Paiute (10.5%, a difference of 0.18%), Bangladeshi (10.5%, a difference of 0.32%), Nepalese (10.5%, a difference of 0.40%), and Dutch West Indian (10.6%, a difference of 1.1%).
| Demographics | Rating | Rank | Master's Degree |
| Kiowa | 0.0 /100 | #319 | Tragic 10.8% |
| Immigrants | Micronesia | 0.0 /100 | #320 | Tragic 10.8% |
| Pennsylvania Germans | 0.0 /100 | #321 | Tragic 10.7% |
| Sioux | 0.0 /100 | #322 | Tragic 10.7% |
| Crow | 0.0 /100 | #323 | Tragic 10.6% |
| Dutch West Indians | 0.0 /100 | #324 | Tragic 10.6% |
| Inupiat | 0.0 /100 | #325 | Tragic 10.5% |
| Creek | 0.0 /100 | #326 | Tragic 10.5% |
| Paiute | 0.0 /100 | #327 | Tragic 10.5% |
| Bangladeshis | 0.0 /100 | #328 | Tragic 10.5% |
| Nepalese | 0.0 /100 | #329 | Tragic 10.5% |
| Fijians | 0.0 /100 | #330 | Tragic 10.3% |
| Pueblo | 0.0 /100 | #331 | Tragic 10.3% |
| Immigrants | Azores | 0.0 /100 | #332 | Tragic 10.2% |
| Menominee | 0.0 /100 | #333 | Tragic 10.2% |
Demographics Similar to Immigrants from Denmark by Master's Degree
In terms of master's degree, the demographic groups most similar to Immigrants from Denmark are Russian (19.5%, a difference of 0.030%), Immigrants from Northern Europe (19.5%, a difference of 0.33%), Immigrants from Russia (19.4%, a difference of 0.70%), Mongolian (19.4%, a difference of 0.74%), and Burmese (19.7%, a difference of 0.81%).
| Demographics | Rating | Rank | Master's Degree |
| Immigrants | Sri Lanka | 100.0 /100 | #27 | Exceptional 19.9% |
| Turks | 100.0 /100 | #28 | Exceptional 19.9% |
| Latvians | 100.0 /100 | #29 | Exceptional 19.8% |
| Immigrants | Turkey | 100.0 /100 | #30 | Exceptional 19.7% |
| Immigrants | Korea | 100.0 /100 | #31 | Exceptional 19.7% |
| Burmese | 100.0 /100 | #32 | Exceptional 19.7% |
| Russians | 100.0 /100 | #33 | Exceptional 19.5% |
| Immigrants | Denmark | 100.0 /100 | #34 | Exceptional 19.5% |
| Immigrants | Northern Europe | 100.0 /100 | #35 | Exceptional 19.5% |
| Immigrants | Russia | 100.0 /100 | #36 | Exceptional 19.4% |
| Mongolians | 100.0 /100 | #37 | Exceptional 19.4% |
| Bolivians | 100.0 /100 | #38 | Exceptional 19.3% |
| Immigrants | Spain | 100.0 /100 | #39 | Exceptional 19.1% |
| Immigrants | Bolivia | 100.0 /100 | #40 | Exceptional 19.1% |
| Immigrants | Latvia | 100.0 /100 | #41 | Exceptional 19.1% |