Bermudan vs Immigrants from Fiji Master's Degree
COMPARE
Bermudan
Immigrants from Fiji
Master's Degree
Master's Degree Comparison
Bermudans
Immigrants from Fiji
15.4%
MASTER'S DEGREE
73.9/ 100
METRIC RATING
156th/ 347
METRIC RANK
12.4%
MASTER'S DEGREE
0.5/ 100
METRIC RATING
265th/ 347
METRIC RANK
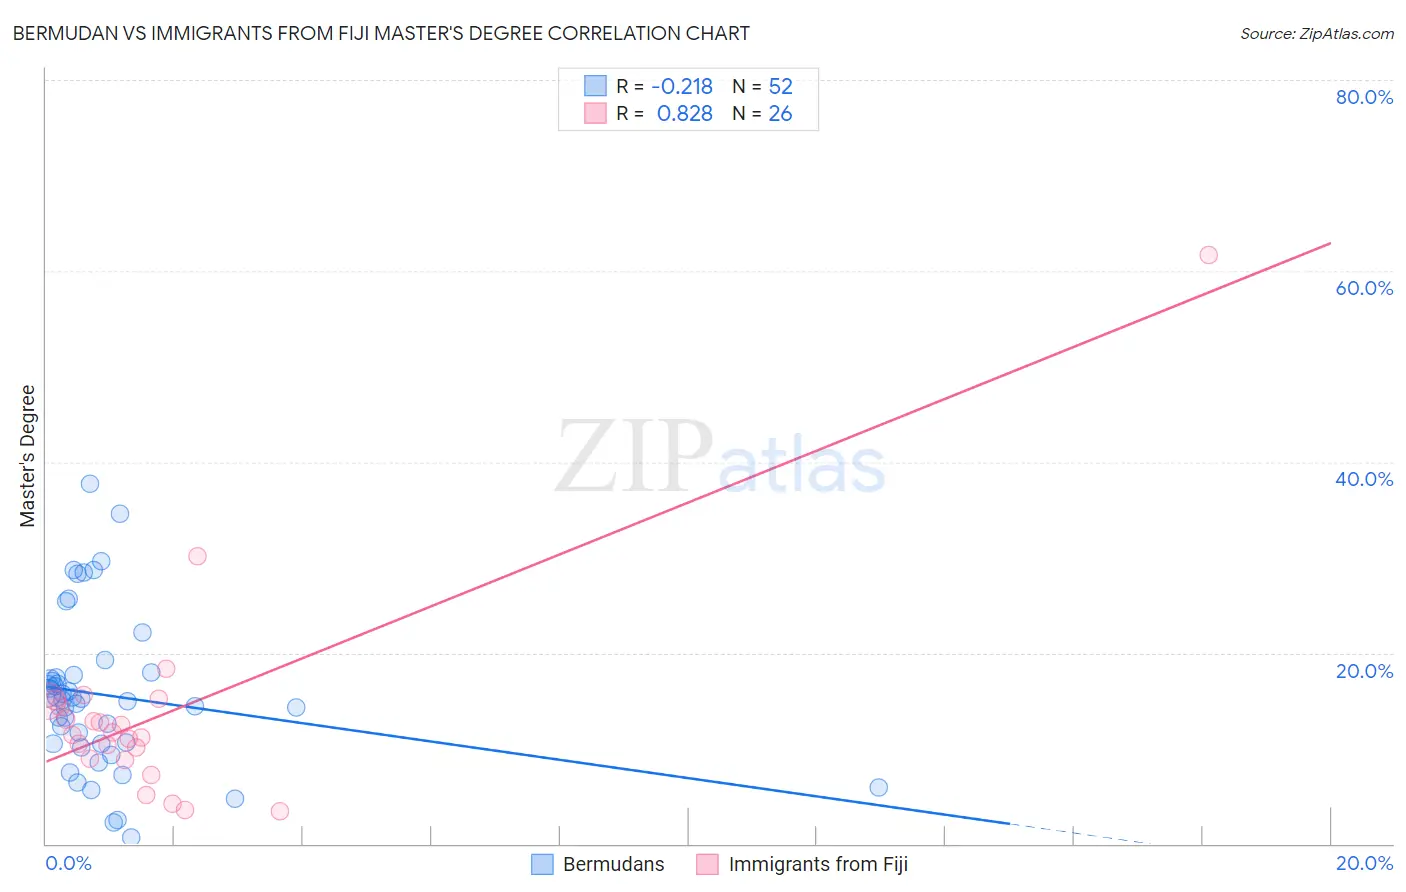
Bermudan vs Immigrants from Fiji Master's Degree Correlation Chart
The statistical analysis conducted on geographies consisting of 55,727,694 people shows a weak negative correlation between the proportion of Bermudans and percentage of population with at least master's degree education in the United States with a correlation coefficient (R) of -0.218 and weighted average of 15.4%. Similarly, the statistical analysis conducted on geographies consisting of 93,754,667 people shows a very strong positive correlation between the proportion of Immigrants from Fiji and percentage of population with at least master's degree education in the United States with a correlation coefficient (R) of 0.828 and weighted average of 12.4%, a difference of 24.2%.
Master's Degree Correlation Summary
| Measurement | Bermudan | Immigrants from Fiji |
| Minimum | 0.60% | 3.5% |
| Maximum | 37.8% | 61.7% |
| Range | 37.2% | 58.2% |
| Mean | 15.5% | 13.6% |
| Median | 15.1% | 11.5% |
| Interquartile 25% (IQ1) | 10.5% | 8.9% |
| Interquartile 75% (IQ3) | 17.5% | 14.9% |
| Interquartile Range (IQR) | 7.0% | 6.0% |
| Standard Deviation (Sample) | 8.1% | 11.2% |
| Standard Deviation (Population) | 8.0% | 11.0% |
Similar Demographics by Master's Degree
Demographics Similar to Bermudans by Master's Degree
In terms of master's degree, the demographic groups most similar to Bermudans are Immigrants from Cameroon (15.4%, a difference of 0.35%), Immigrants from Bangladesh (15.5%, a difference of 0.36%), Immigrants from Poland (15.4%, a difference of 0.39%), Immigrants from South America (15.5%, a difference of 0.40%), and Luxembourger (15.3%, a difference of 0.45%).
| Demographics | Rating | Rank | Master's Degree |
| Ghanaians | 78.2 /100 | #149 | Good 15.5% |
| Slovenes | 78.0 /100 | #150 | Good 15.5% |
| Iraqis | 77.3 /100 | #151 | Good 15.5% |
| Slavs | 77.0 /100 | #152 | Good 15.5% |
| Icelanders | 76.8 /100 | #153 | Good 15.5% |
| Immigrants | South America | 76.3 /100 | #154 | Good 15.5% |
| Immigrants | Bangladesh | 76.1 /100 | #155 | Good 15.5% |
| Bermudans | 73.9 /100 | #156 | Good 15.4% |
| Immigrants | Cameroon | 71.7 /100 | #157 | Good 15.4% |
| Immigrants | Poland | 71.5 /100 | #158 | Good 15.4% |
| Luxembourgers | 71.0 /100 | #159 | Good 15.3% |
| Kenyans | 70.3 /100 | #160 | Good 15.3% |
| Sudanese | 68.7 /100 | #161 | Good 15.3% |
| Peruvians | 68.7 /100 | #162 | Good 15.3% |
| Uruguayans | 67.1 /100 | #163 | Good 15.3% |
Demographics Similar to Immigrants from Fiji by Master's Degree
In terms of master's degree, the demographic groups most similar to Immigrants from Fiji are Belizean (12.4%, a difference of 0.020%), Bahamian (12.4%, a difference of 0.16%), Central American Indian (12.4%, a difference of 0.19%), Nicaraguan (12.5%, a difference of 0.42%), and Tongan (12.5%, a difference of 0.61%).
| Demographics | Rating | Rank | Master's Degree |
| Immigrants | Liberia | 0.6 /100 | #258 | Tragic 12.5% |
| Japanese | 0.6 /100 | #259 | Tragic 12.5% |
| Dominicans | 0.6 /100 | #260 | Tragic 12.5% |
| Tongans | 0.6 /100 | #261 | Tragic 12.5% |
| Nicaraguans | 0.6 /100 | #262 | Tragic 12.5% |
| Central American Indians | 0.5 /100 | #263 | Tragic 12.4% |
| Belizeans | 0.5 /100 | #264 | Tragic 12.4% |
| Immigrants | Fiji | 0.5 /100 | #265 | Tragic 12.4% |
| Bahamians | 0.5 /100 | #266 | Tragic 12.4% |
| Americans | 0.4 /100 | #267 | Tragic 12.3% |
| Native Hawaiians | 0.4 /100 | #268 | Tragic 12.3% |
| Central Americans | 0.3 /100 | #269 | Tragic 12.2% |
| Salvadorans | 0.3 /100 | #270 | Tragic 12.2% |
| Haitians | 0.3 /100 | #271 | Tragic 12.1% |
| Comanche | 0.3 /100 | #272 | Tragic 12.1% |