Bermudan vs Hawaiian Master's Degree
COMPARE
Bermudan
Hawaiian
Master's Degree
Master's Degree Comparison
Bermudans
Hawaiians
15.4%
MASTER'S DEGREE
73.9/ 100
METRIC RATING
156th/ 347
METRIC RANK
11.6%
MASTER'S DEGREE
0.1/ 100
METRIC RATING
294th/ 347
METRIC RANK
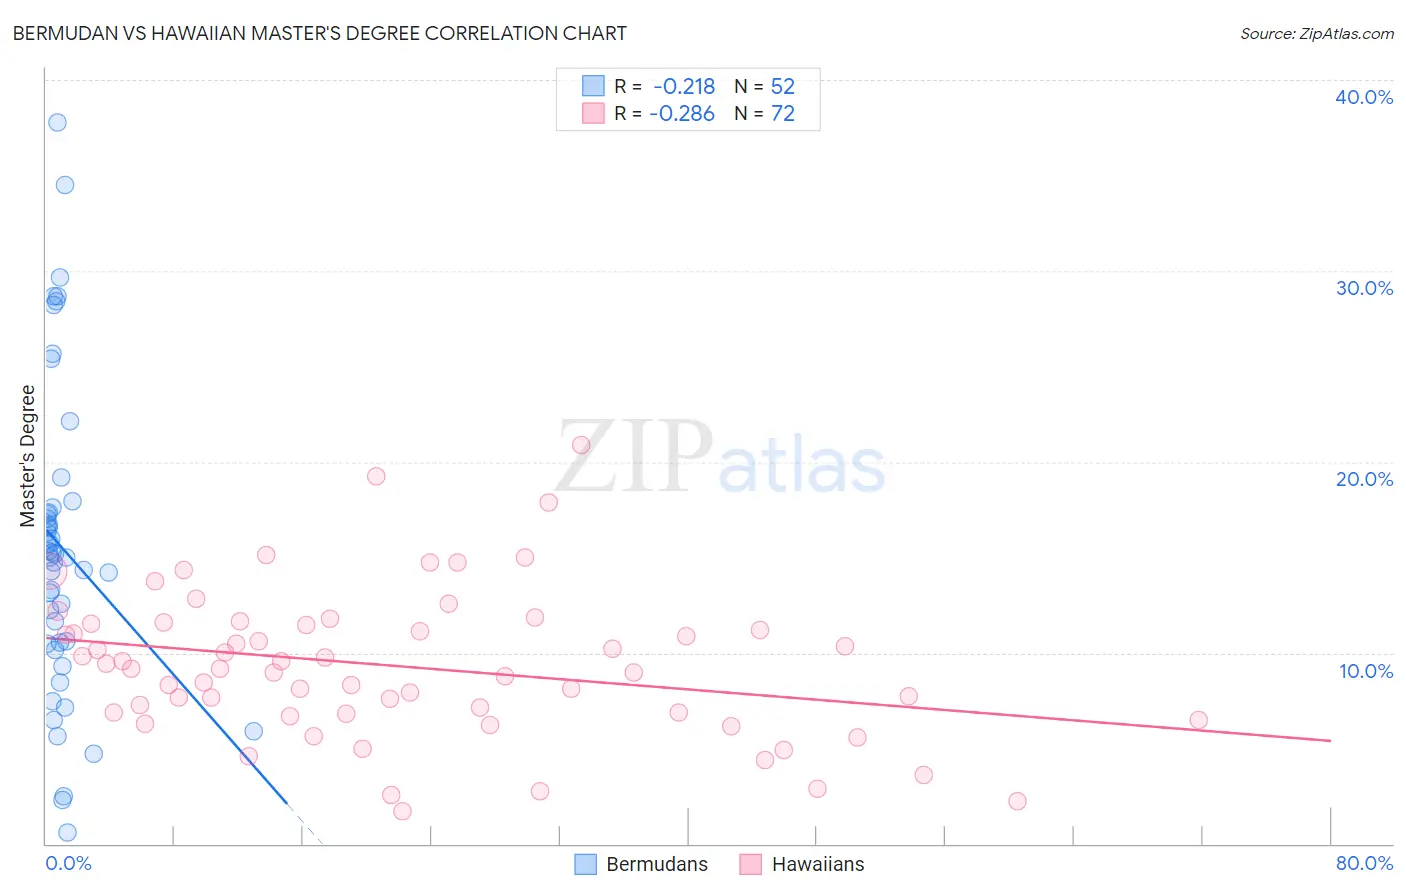
Bermudan vs Hawaiian Master's Degree Correlation Chart
The statistical analysis conducted on geographies consisting of 55,727,694 people shows a weak negative correlation between the proportion of Bermudans and percentage of population with at least master's degree education in the United States with a correlation coefficient (R) of -0.218 and weighted average of 15.4%. Similarly, the statistical analysis conducted on geographies consisting of 327,485,009 people shows a weak negative correlation between the proportion of Hawaiians and percentage of population with at least master's degree education in the United States with a correlation coefficient (R) of -0.286 and weighted average of 11.6%, a difference of 33.0%.
Master's Degree Correlation Summary
| Measurement | Bermudan | Hawaiian |
| Minimum | 0.60% | 1.7% |
| Maximum | 37.8% | 20.9% |
| Range | 37.2% | 19.2% |
| Mean | 15.5% | 9.3% |
| Median | 15.1% | 9.2% |
| Interquartile 25% (IQ1) | 10.5% | 6.8% |
| Interquartile 75% (IQ3) | 17.5% | 11.5% |
| Interquartile Range (IQR) | 7.0% | 4.7% |
| Standard Deviation (Sample) | 8.1% | 3.9% |
| Standard Deviation (Population) | 8.0% | 3.8% |
Similar Demographics by Master's Degree
Demographics Similar to Bermudans by Master's Degree
In terms of master's degree, the demographic groups most similar to Bermudans are Immigrants from Cameroon (15.4%, a difference of 0.35%), Immigrants from Bangladesh (15.5%, a difference of 0.36%), Immigrants from Poland (15.4%, a difference of 0.39%), Immigrants from South America (15.5%, a difference of 0.40%), and Luxembourger (15.3%, a difference of 0.45%).
| Demographics | Rating | Rank | Master's Degree |
| Ghanaians | 78.2 /100 | #149 | Good 15.5% |
| Slovenes | 78.0 /100 | #150 | Good 15.5% |
| Iraqis | 77.3 /100 | #151 | Good 15.5% |
| Slavs | 77.0 /100 | #152 | Good 15.5% |
| Icelanders | 76.8 /100 | #153 | Good 15.5% |
| Immigrants | South America | 76.3 /100 | #154 | Good 15.5% |
| Immigrants | Bangladesh | 76.1 /100 | #155 | Good 15.5% |
| Bermudans | 73.9 /100 | #156 | Good 15.4% |
| Immigrants | Cameroon | 71.7 /100 | #157 | Good 15.4% |
| Immigrants | Poland | 71.5 /100 | #158 | Good 15.4% |
| Luxembourgers | 71.0 /100 | #159 | Good 15.3% |
| Kenyans | 70.3 /100 | #160 | Good 15.3% |
| Sudanese | 68.7 /100 | #161 | Good 15.3% |
| Peruvians | 68.7 /100 | #162 | Good 15.3% |
| Uruguayans | 67.1 /100 | #163 | Good 15.3% |
Demographics Similar to Hawaiians by Master's Degree
In terms of master's degree, the demographic groups most similar to Hawaiians are Alaska Native (11.6%, a difference of 0.10%), Marshallese (11.6%, a difference of 0.15%), Alaskan Athabascan (11.6%, a difference of 0.16%), Immigrants from Yemen (11.6%, a difference of 0.28%), and Immigrants from Guatemala (11.6%, a difference of 0.32%).
| Demographics | Rating | Rank | Master's Degree |
| Immigrants | Haiti | 0.1 /100 | #287 | Tragic 11.8% |
| Immigrants | Honduras | 0.1 /100 | #288 | Tragic 11.8% |
| Guatemalans | 0.1 /100 | #289 | Tragic 11.7% |
| Ute | 0.1 /100 | #290 | Tragic 11.7% |
| Colville | 0.1 /100 | #291 | Tragic 11.6% |
| Immigrants | Guatemala | 0.1 /100 | #292 | Tragic 11.6% |
| Alaska Natives | 0.1 /100 | #293 | Tragic 11.6% |
| Hawaiians | 0.1 /100 | #294 | Tragic 11.6% |
| Marshallese | 0.1 /100 | #295 | Tragic 11.6% |
| Alaskan Athabascans | 0.1 /100 | #296 | Tragic 11.6% |
| Immigrants | Yemen | 0.1 /100 | #297 | Tragic 11.6% |
| Samoans | 0.1 /100 | #298 | Tragic 11.5% |
| Chickasaw | 0.1 /100 | #299 | Tragic 11.4% |
| Chippewa | 0.1 /100 | #300 | Tragic 11.4% |
| Tsimshian | 0.1 /100 | #301 | Tragic 11.4% |