Bermudan vs Immigrants from Colombia Vision Disability
COMPARE
Bermudan
Immigrants from Colombia
Vision Disability
Vision Disability Comparison
Bermudans
Immigrants from Colombia
2.2%
VISION DISABILITY
9.0/ 100
METRIC RATING
212th/ 347
METRIC RANK
2.1%
VISION DISABILITY
72.1/ 100
METRIC RATING
155th/ 347
METRIC RANK
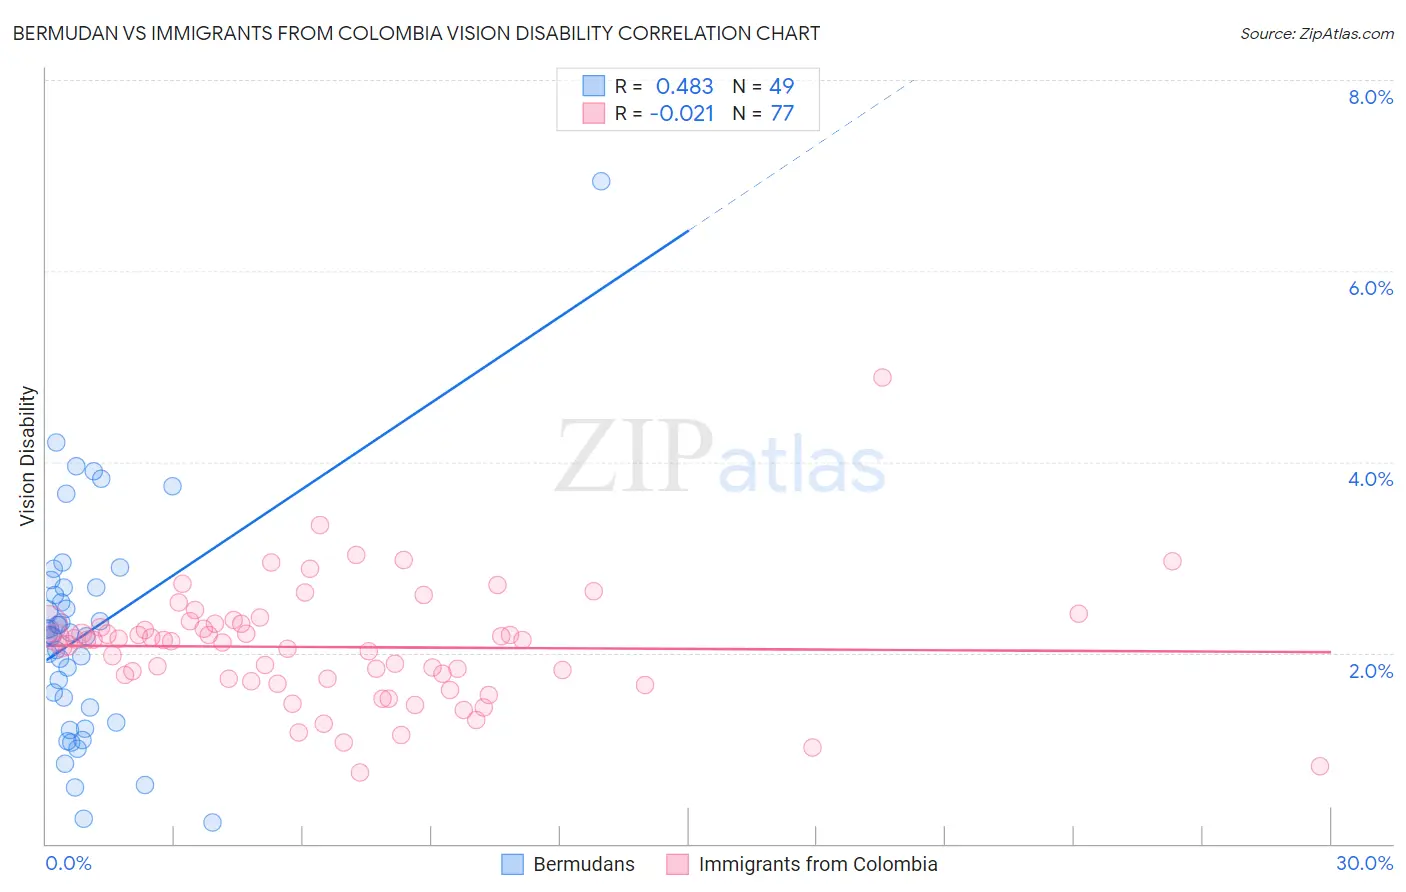
Bermudan vs Immigrants from Colombia Vision Disability Correlation Chart
The statistical analysis conducted on geographies consisting of 55,718,331 people shows a moderate positive correlation between the proportion of Bermudans and percentage of population with vision disability in the United States with a correlation coefficient (R) of 0.483 and weighted average of 2.2%. Similarly, the statistical analysis conducted on geographies consisting of 378,455,672 people shows no correlation between the proportion of Immigrants from Colombia and percentage of population with vision disability in the United States with a correlation coefficient (R) of -0.021 and weighted average of 2.1%, a difference of 5.2%.
Vision Disability Correlation Summary
| Measurement | Bermudan | Immigrants from Colombia |
| Minimum | 0.22% | 0.75% |
| Maximum | 6.9% | 4.9% |
| Range | 6.7% | 4.1% |
| Mean | 2.2% | 2.1% |
| Median | 2.2% | 2.1% |
| Interquartile 25% (IQ1) | 1.3% | 1.7% |
| Interquartile 75% (IQ3) | 2.7% | 2.3% |
| Interquartile Range (IQR) | 1.3% | 0.59% |
| Standard Deviation (Sample) | 1.2% | 0.61% |
| Standard Deviation (Population) | 1.2% | 0.61% |
Similar Demographics by Vision Disability
Demographics Similar to Bermudans by Vision Disability
In terms of vision disability, the demographic groups most similar to Bermudans are Immigrants from Ghana (2.2%, a difference of 0.010%), Indonesian (2.2%, a difference of 0.090%), Trinidadian and Tobagonian (2.2%, a difference of 0.14%), Nigerian (2.3%, a difference of 0.35%), and Immigrants from Uruguay (2.2%, a difference of 0.43%).
| Demographics | Rating | Rank | Vision Disability |
| Samoans | 15.7 /100 | #205 | Poor 2.2% |
| Pennsylvania Germans | 14.5 /100 | #206 | Poor 2.2% |
| Immigrants | Nigeria | 13.5 /100 | #207 | Poor 2.2% |
| Germans | 13.4 /100 | #208 | Poor 2.2% |
| Immigrants | Brazil | 13.1 /100 | #209 | Poor 2.2% |
| Immigrants | Uruguay | 11.5 /100 | #210 | Poor 2.2% |
| Indonesians | 9.5 /100 | #211 | Tragic 2.2% |
| Bermudans | 9.0 /100 | #212 | Tragic 2.2% |
| Immigrants | Ghana | 8.9 /100 | #213 | Tragic 2.2% |
| Trinidadians and Tobagonians | 8.2 /100 | #214 | Tragic 2.2% |
| Nigerians | 7.2 /100 | #215 | Tragic 2.3% |
| Immigrants | Trinidad and Tobago | 6.1 /100 | #216 | Tragic 2.3% |
| Barbadians | 5.1 /100 | #217 | Tragic 2.3% |
| Portuguese | 4.9 /100 | #218 | Tragic 2.3% |
| Ecuadorians | 4.6 /100 | #219 | Tragic 2.3% |
Demographics Similar to Immigrants from Colombia by Vision Disability
In terms of vision disability, the demographic groups most similar to Immigrants from Colombia are Pakistani (2.1%, a difference of 0.040%), Slovene (2.1%, a difference of 0.12%), Immigrants from South America (2.1%, a difference of 0.14%), Serbian (2.1%, a difference of 0.14%), and Immigrants from Uzbekistan (2.1%, a difference of 0.17%).
| Demographics | Rating | Rank | Vision Disability |
| Finns | 78.3 /100 | #148 | Good 2.1% |
| Colombians | 76.2 /100 | #149 | Good 2.1% |
| Belgians | 75.9 /100 | #150 | Good 2.1% |
| Immigrants | Norway | 75.5 /100 | #151 | Good 2.1% |
| Immigrants | Southern Europe | 74.6 /100 | #152 | Good 2.1% |
| Immigrants | South America | 73.8 /100 | #153 | Good 2.1% |
| Slovenes | 73.6 /100 | #154 | Good 2.1% |
| Immigrants | Colombia | 72.1 /100 | #155 | Good 2.1% |
| Pakistanis | 71.6 /100 | #156 | Good 2.1% |
| Serbians | 70.2 /100 | #157 | Good 2.1% |
| Immigrants | Uzbekistan | 69.9 /100 | #158 | Good 2.1% |
| South Africans | 69.8 /100 | #159 | Good 2.1% |
| Austrians | 69.0 /100 | #160 | Good 2.1% |
| Iraqis | 67.7 /100 | #161 | Good 2.1% |
| Hungarians | 67.4 /100 | #162 | Good 2.1% |