Bermudan vs Tongan No Schooling Completed
COMPARE
Bermudan
Tongan
No Schooling Completed
No Schooling Completed Comparison
Bermudans
Tongans
2.1%
NO SCHOOLING COMPLETED
30.7/ 100
METRIC RATING
191st/ 347
METRIC RANK
2.3%
NO SCHOOLING COMPLETED
6.8/ 100
METRIC RATING
216th/ 347
METRIC RANK
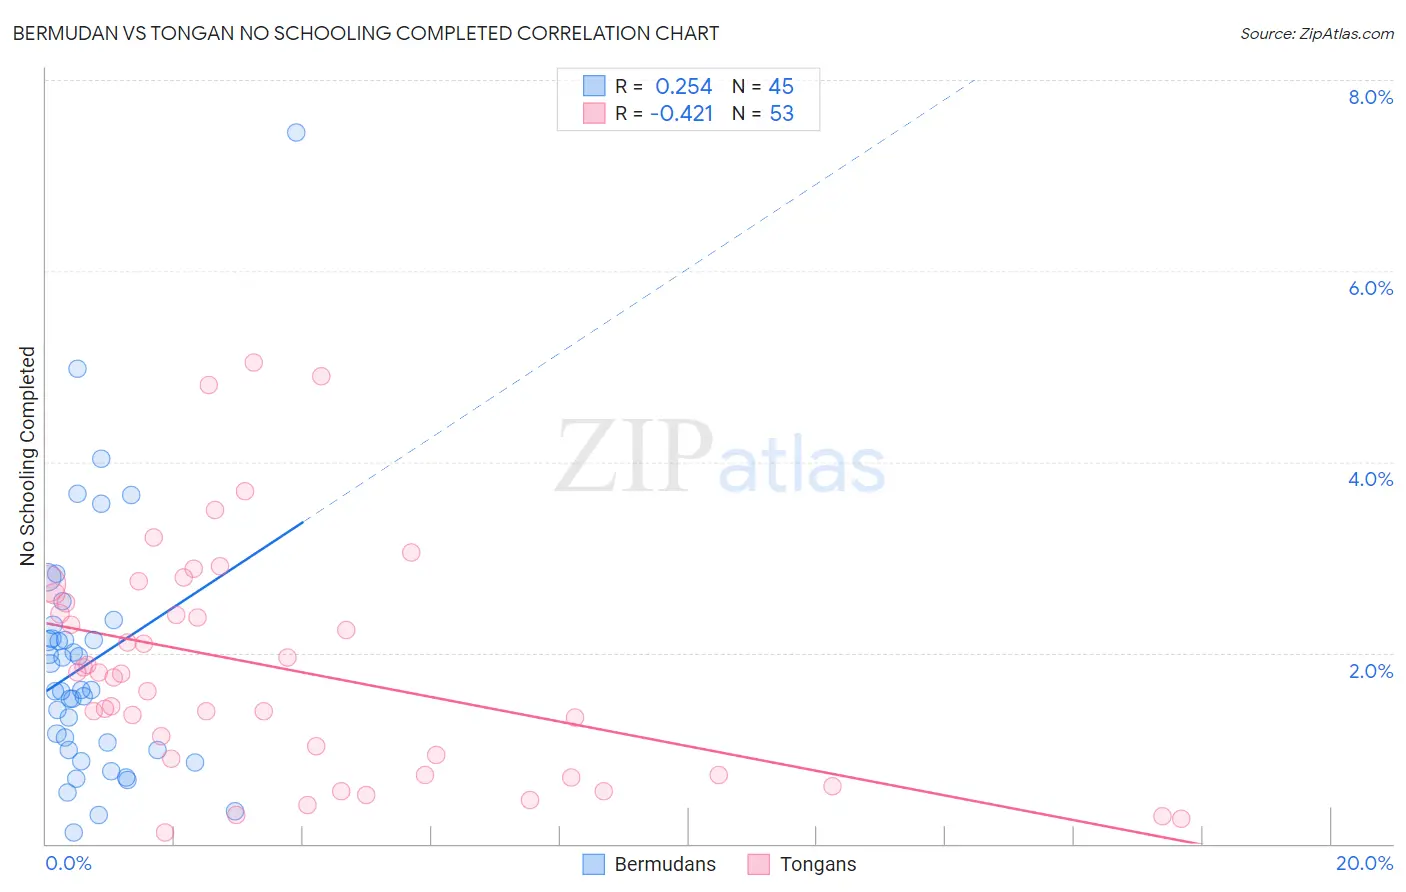
Bermudan vs Tongan No Schooling Completed Correlation Chart
The statistical analysis conducted on geographies consisting of 55,639,195 people shows a weak positive correlation between the proportion of Bermudans and percentage of population with no schooling in the United States with a correlation coefficient (R) of 0.254 and weighted average of 2.1%. Similarly, the statistical analysis conducted on geographies consisting of 102,433,960 people shows a moderate negative correlation between the proportion of Tongans and percentage of population with no schooling in the United States with a correlation coefficient (R) of -0.421 and weighted average of 2.3%, a difference of 5.9%.
No Schooling Completed Correlation Summary
| Measurement | Bermudan | Tongan |
| Minimum | 0.12% | 0.12% |
| Maximum | 7.4% | 5.0% |
| Range | 7.3% | 4.9% |
| Mean | 1.9% | 1.8% |
| Median | 1.6% | 1.8% |
| Interquartile 25% (IQ1) | 0.98% | 0.81% |
| Interquartile 75% (IQ3) | 2.2% | 2.6% |
| Interquartile Range (IQR) | 1.2% | 1.8% |
| Standard Deviation (Sample) | 1.3% | 1.2% |
| Standard Deviation (Population) | 1.3% | 1.2% |
Similar Demographics by No Schooling Completed
Demographics Similar to Bermudans by No Schooling Completed
In terms of no schooling completed, the demographic groups most similar to Bermudans are Guamanian/Chamorro (2.2%, a difference of 0.14%), Paraguayan (2.2%, a difference of 0.21%), Spanish American (2.1%, a difference of 0.29%), Immigrants from Albania (2.2%, a difference of 0.38%), and Hawaiian (2.2%, a difference of 0.58%).
| Demographics | Rating | Rank | No Schooling Completed |
| Pima | 41.3 /100 | #184 | Average 2.1% |
| Mongolians | 40.8 /100 | #185 | Average 2.1% |
| Immigrants | Bosnia and Herzegovina | 38.6 /100 | #186 | Fair 2.1% |
| Navajo | 36.5 /100 | #187 | Fair 2.1% |
| Immigrants | Kenya | 36.2 /100 | #188 | Fair 2.1% |
| Immigrants | Egypt | 36.1 /100 | #189 | Fair 2.1% |
| Spanish Americans | 32.6 /100 | #190 | Fair 2.1% |
| Bermudans | 30.7 /100 | #191 | Fair 2.1% |
| Guamanians/Chamorros | 29.8 /100 | #192 | Fair 2.2% |
| Paraguayans | 29.3 /100 | #193 | Fair 2.2% |
| Immigrants | Albania | 28.3 /100 | #194 | Fair 2.2% |
| Hawaiians | 27.0 /100 | #195 | Fair 2.2% |
| Immigrants | Ukraine | 26.1 /100 | #196 | Fair 2.2% |
| Immigrants | Southern Europe | 23.8 /100 | #197 | Fair 2.2% |
| Immigrants | Chile | 22.7 /100 | #198 | Fair 2.2% |
Demographics Similar to Tongans by No Schooling Completed
In terms of no schooling completed, the demographic groups most similar to Tongans are Immigrants from Syria (2.3%, a difference of 0.090%), Immigrants from Nepal (2.3%, a difference of 0.19%), Immigrants from Zaire (2.3%, a difference of 0.20%), Samoan (2.3%, a difference of 0.63%), and Senegalese (2.3%, a difference of 0.63%).
| Demographics | Rating | Rank | No Schooling Completed |
| Immigrants | Oceania | 10.2 /100 | #209 | Poor 2.2% |
| Natives/Alaskans | 10.0 /100 | #210 | Tragic 2.2% |
| Immigrants | Panama | 8.8 /100 | #211 | Tragic 2.3% |
| Immigrants | Morocco | 8.7 /100 | #212 | Tragic 2.3% |
| Ute | 8.2 /100 | #213 | Tragic 2.3% |
| Samoans | 8.2 /100 | #214 | Tragic 2.3% |
| Immigrants | Zaire | 7.2 /100 | #215 | Tragic 2.3% |
| Tongans | 6.8 /100 | #216 | Tragic 2.3% |
| Immigrants | Syria | 6.6 /100 | #217 | Tragic 2.3% |
| Immigrants | Nepal | 6.4 /100 | #218 | Tragic 2.3% |
| Senegalese | 5.6 /100 | #219 | Tragic 2.3% |
| Immigrants | Costa Rica | 5.1 /100 | #220 | Tragic 2.3% |
| Immigrants | Sudan | 5.0 /100 | #221 | Tragic 2.3% |
| Sub-Saharan Africans | 4.7 /100 | #222 | Tragic 2.3% |
| Immigrants | Lebanon | 4.5 /100 | #223 | Tragic 2.3% |