Bermudan vs Immigrants from Switzerland No Schooling Completed
COMPARE
Bermudan
Immigrants from Switzerland
No Schooling Completed
No Schooling Completed Comparison
Bermudans
Immigrants from Switzerland
2.1%
NO SCHOOLING COMPLETED
30.7/ 100
METRIC RATING
191st/ 347
METRIC RANK
1.8%
NO SCHOOLING COMPLETED
97.9/ 100
METRIC RATING
102nd/ 347
METRIC RANK
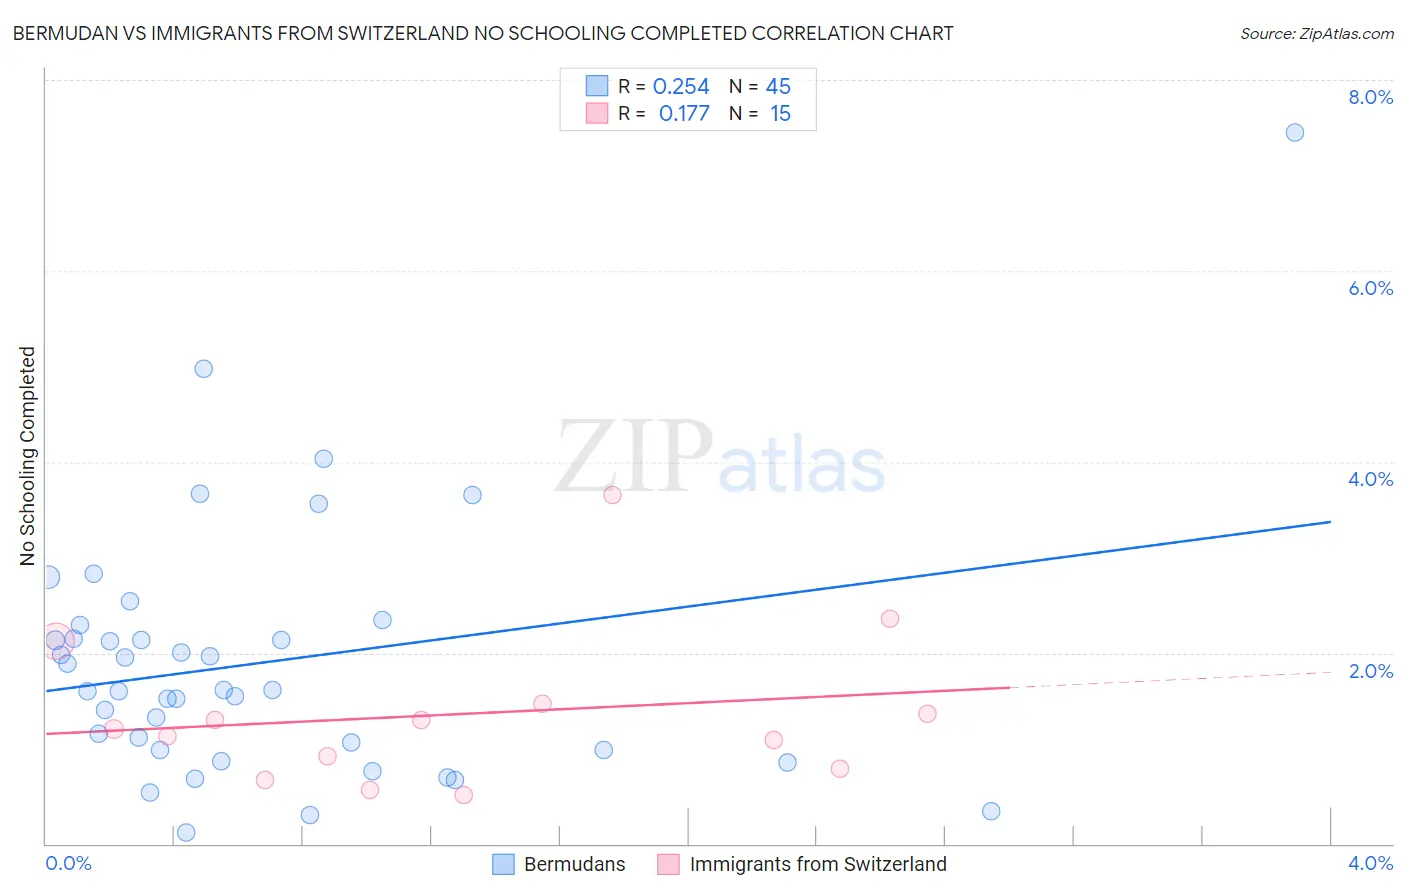
Bermudan vs Immigrants from Switzerland No Schooling Completed Correlation Chart
The statistical analysis conducted on geographies consisting of 55,639,195 people shows a weak positive correlation between the proportion of Bermudans and percentage of population with no schooling in the United States with a correlation coefficient (R) of 0.254 and weighted average of 2.1%. Similarly, the statistical analysis conducted on geographies consisting of 147,132,968 people shows a poor positive correlation between the proportion of Immigrants from Switzerland and percentage of population with no schooling in the United States with a correlation coefficient (R) of 0.177 and weighted average of 1.8%, a difference of 17.9%.
No Schooling Completed Correlation Summary
| Measurement | Bermudan | Immigrants from Switzerland |
| Minimum | 0.12% | 0.51% |
| Maximum | 7.4% | 3.7% |
| Range | 7.3% | 3.1% |
| Mean | 1.9% | 1.4% |
| Median | 1.6% | 1.2% |
| Interquartile 25% (IQ1) | 0.98% | 0.79% |
| Interquartile 75% (IQ3) | 2.2% | 1.5% |
| Interquartile Range (IQR) | 1.2% | 0.68% |
| Standard Deviation (Sample) | 1.3% | 0.82% |
| Standard Deviation (Population) | 1.3% | 0.79% |
Similar Demographics by No Schooling Completed
Demographics Similar to Bermudans by No Schooling Completed
In terms of no schooling completed, the demographic groups most similar to Bermudans are Guamanian/Chamorro (2.2%, a difference of 0.14%), Paraguayan (2.2%, a difference of 0.21%), Spanish American (2.1%, a difference of 0.29%), Immigrants from Albania (2.2%, a difference of 0.38%), and Hawaiian (2.2%, a difference of 0.58%).
| Demographics | Rating | Rank | No Schooling Completed |
| Pima | 41.3 /100 | #184 | Average 2.1% |
| Mongolians | 40.8 /100 | #185 | Average 2.1% |
| Immigrants | Bosnia and Herzegovina | 38.6 /100 | #186 | Fair 2.1% |
| Navajo | 36.5 /100 | #187 | Fair 2.1% |
| Immigrants | Kenya | 36.2 /100 | #188 | Fair 2.1% |
| Immigrants | Egypt | 36.1 /100 | #189 | Fair 2.1% |
| Spanish Americans | 32.6 /100 | #190 | Fair 2.1% |
| Bermudans | 30.7 /100 | #191 | Fair 2.1% |
| Guamanians/Chamorros | 29.8 /100 | #192 | Fair 2.2% |
| Paraguayans | 29.3 /100 | #193 | Fair 2.2% |
| Immigrants | Albania | 28.3 /100 | #194 | Fair 2.2% |
| Hawaiians | 27.0 /100 | #195 | Fair 2.2% |
| Immigrants | Ukraine | 26.1 /100 | #196 | Fair 2.2% |
| Immigrants | Southern Europe | 23.8 /100 | #197 | Fair 2.2% |
| Immigrants | Chile | 22.7 /100 | #198 | Fair 2.2% |
Demographics Similar to Immigrants from Switzerland by No Schooling Completed
In terms of no schooling completed, the demographic groups most similar to Immigrants from Switzerland are Immigrants from Czechoslovakia (1.8%, a difference of 0.0%), Basque (1.8%, a difference of 0.050%), Immigrants from Singapore (1.8%, a difference of 0.30%), Choctaw (1.8%, a difference of 0.50%), and Thai (1.8%, a difference of 0.63%).
| Demographics | Rating | Rank | No Schooling Completed |
| Puget Sound Salish | 98.5 /100 | #95 | Exceptional 1.8% |
| Bhutanese | 98.4 /100 | #96 | Exceptional 1.8% |
| Immigrants | Ireland | 98.4 /100 | #97 | Exceptional 1.8% |
| Iranians | 98.2 /100 | #98 | Exceptional 1.8% |
| Choctaw | 98.1 /100 | #99 | Exceptional 1.8% |
| Immigrants | Singapore | 98.0 /100 | #100 | Exceptional 1.8% |
| Immigrants | Czechoslovakia | 97.9 /100 | #101 | Exceptional 1.8% |
| Immigrants | Switzerland | 97.9 /100 | #102 | Exceptional 1.8% |
| Basques | 97.9 /100 | #103 | Exceptional 1.8% |
| Thais | 97.5 /100 | #104 | Exceptional 1.8% |
| German Russians | 97.5 /100 | #105 | Exceptional 1.8% |
| Immigrants | France | 97.3 /100 | #106 | Exceptional 1.8% |
| Yugoslavians | 97.2 /100 | #107 | Exceptional 1.8% |
| Okinawans | 97.1 /100 | #108 | Exceptional 1.8% |
| Immigrants | Saudi Arabia | 96.8 /100 | #109 | Exceptional 1.9% |