Belgian vs Iroquois No Schooling Completed
COMPARE
Belgian
Iroquois
No Schooling Completed
No Schooling Completed Comparison
Belgians
Iroquois
1.6%
NO SCHOOLING COMPLETED
99.9/ 100
METRIC RATING
37th/ 347
METRIC RANK
1.9%
NO SCHOOLING COMPLETED
95.1/ 100
METRIC RATING
119th/ 347
METRIC RANK
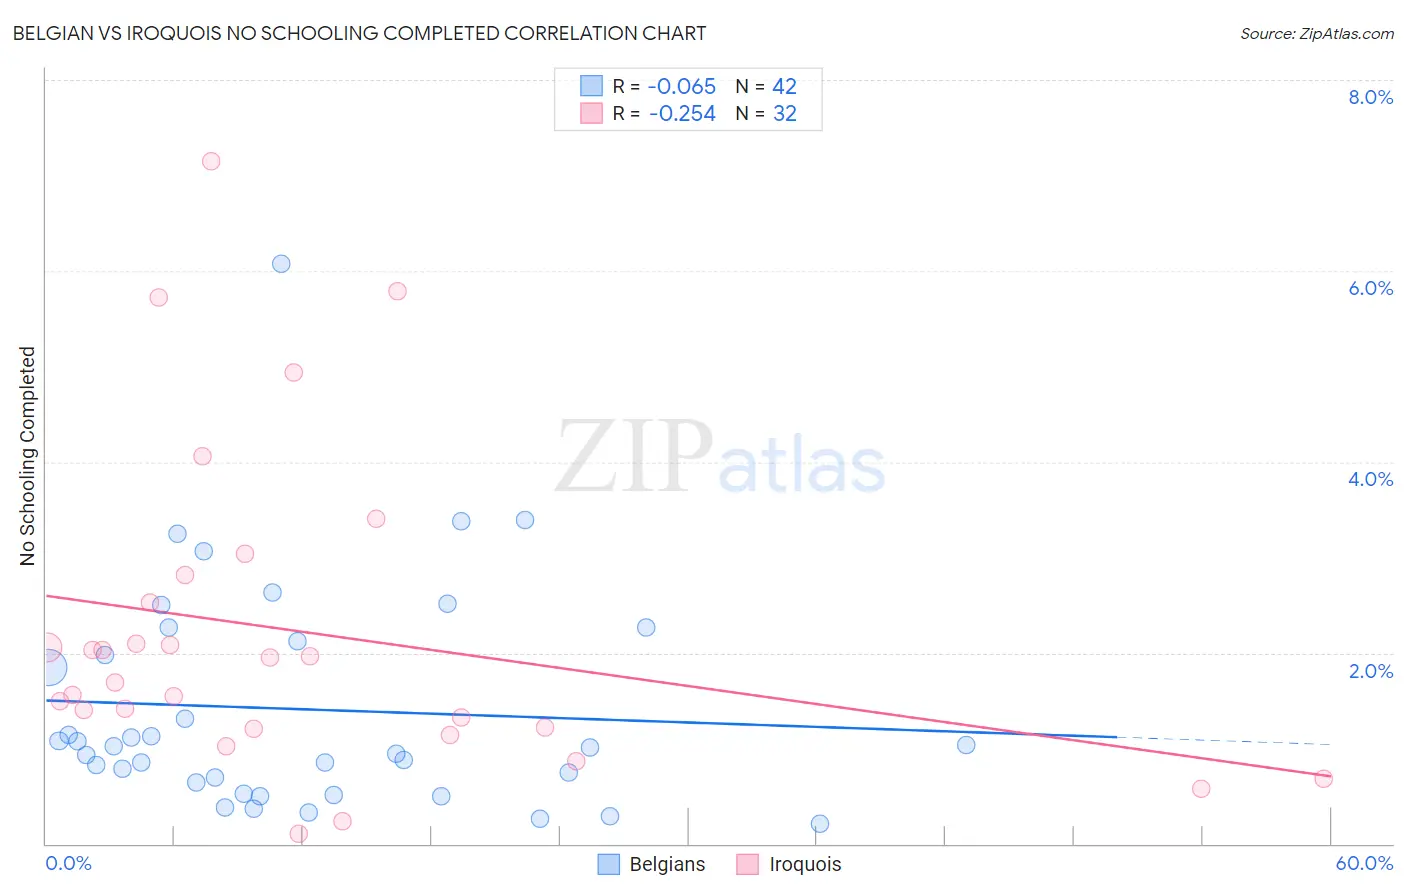
Belgian vs Iroquois No Schooling Completed Correlation Chart
The statistical analysis conducted on geographies consisting of 350,991,353 people shows a slight negative correlation between the proportion of Belgians and percentage of population with no schooling in the United States with a correlation coefficient (R) of -0.065 and weighted average of 1.6%. Similarly, the statistical analysis conducted on geographies consisting of 205,850,769 people shows a weak negative correlation between the proportion of Iroquois and percentage of population with no schooling in the United States with a correlation coefficient (R) of -0.254 and weighted average of 1.9%, a difference of 19.4%.
No Schooling Completed Correlation Summary
| Measurement | Belgian | Iroquois |
| Minimum | 0.22% | 0.10% |
| Maximum | 6.1% | 7.1% |
| Range | 5.9% | 7.0% |
| Mean | 1.4% | 2.2% |
| Median | 1.0% | 1.8% |
| Interquartile 25% (IQ1) | 0.64% | 1.2% |
| Interquartile 75% (IQ3) | 2.1% | 2.7% |
| Interquartile Range (IQR) | 1.5% | 1.5% |
| Standard Deviation (Sample) | 1.2% | 1.7% |
| Standard Deviation (Population) | 1.2% | 1.6% |
Similar Demographics by No Schooling Completed
Demographics Similar to Belgians by No Schooling Completed
In terms of no schooling completed, the demographic groups most similar to Belgians are Northern European (1.6%, a difference of 0.13%), Aleut (1.6%, a difference of 0.27%), Native Hawaiian (1.6%, a difference of 0.40%), Luxembourger (1.6%, a difference of 0.75%), and Hungarian (1.6%, a difference of 1.0%).
| Demographics | Rating | Rank | No Schooling Completed |
| British | 100.0 /100 | #30 | Exceptional 1.5% |
| Inupiat | 100.0 /100 | #31 | Exceptional 1.5% |
| Swiss | 100.0 /100 | #32 | Exceptional 1.5% |
| Italians | 100.0 /100 | #33 | Exceptional 1.5% |
| Latvians | 100.0 /100 | #34 | Exceptional 1.5% |
| Eastern Europeans | 100.0 /100 | #35 | Exceptional 1.6% |
| Aleuts | 99.9 /100 | #36 | Exceptional 1.6% |
| Belgians | 99.9 /100 | #37 | Exceptional 1.6% |
| Northern Europeans | 99.9 /100 | #38 | Exceptional 1.6% |
| Native Hawaiians | 99.9 /100 | #39 | Exceptional 1.6% |
| Luxembourgers | 99.9 /100 | #40 | Exceptional 1.6% |
| Hungarians | 99.9 /100 | #41 | Exceptional 1.6% |
| Bulgarians | 99.9 /100 | #42 | Exceptional 1.6% |
| Australians | 99.9 /100 | #43 | Exceptional 1.6% |
| Estonians | 99.9 /100 | #44 | Exceptional 1.6% |
Demographics Similar to Iroquois by No Schooling Completed
In terms of no schooling completed, the demographic groups most similar to Iroquois are Spanish (1.9%, a difference of 0.35%), Immigrants from Bulgaria (1.9%, a difference of 0.40%), Immigrants from Croatia (1.9%, a difference of 0.47%), Cree (1.9%, a difference of 0.50%), and Immigrants from Serbia (1.9%, a difference of 0.58%).
| Demographics | Rating | Rank | No Schooling Completed |
| Pueblo | 96.4 /100 | #112 | Exceptional 1.9% |
| Immigrants | Zimbabwe | 96.2 /100 | #113 | Exceptional 1.9% |
| Immigrants | Norway | 96.1 /100 | #114 | Exceptional 1.9% |
| Syrians | 96.0 /100 | #115 | Exceptional 1.9% |
| Lebanese | 96.0 /100 | #116 | Exceptional 1.9% |
| Immigrants | Serbia | 95.8 /100 | #117 | Exceptional 1.9% |
| Spanish | 95.5 /100 | #118 | Exceptional 1.9% |
| Iroquois | 95.1 /100 | #119 | Exceptional 1.9% |
| Immigrants | Bulgaria | 94.6 /100 | #120 | Exceptional 1.9% |
| Immigrants | Croatia | 94.5 /100 | #121 | Exceptional 1.9% |
| Cree | 94.5 /100 | #122 | Exceptional 1.9% |
| Immigrants | Kuwait | 93.9 /100 | #123 | Exceptional 1.9% |
| Cambodians | 93.8 /100 | #124 | Exceptional 1.9% |
| Immigrants | Europe | 93.7 /100 | #125 | Exceptional 1.9% |
| Immigrants | Romania | 92.6 /100 | #126 | Exceptional 1.9% |