Belgian vs Egyptian No Schooling Completed
COMPARE
Belgian
Egyptian
No Schooling Completed
No Schooling Completed Comparison
Belgians
Egyptians
1.6%
NO SCHOOLING COMPLETED
99.9/ 100
METRIC RATING
37th/ 347
METRIC RANK
2.1%
NO SCHOOLING COMPLETED
59.2/ 100
METRIC RATING
167th/ 347
METRIC RANK
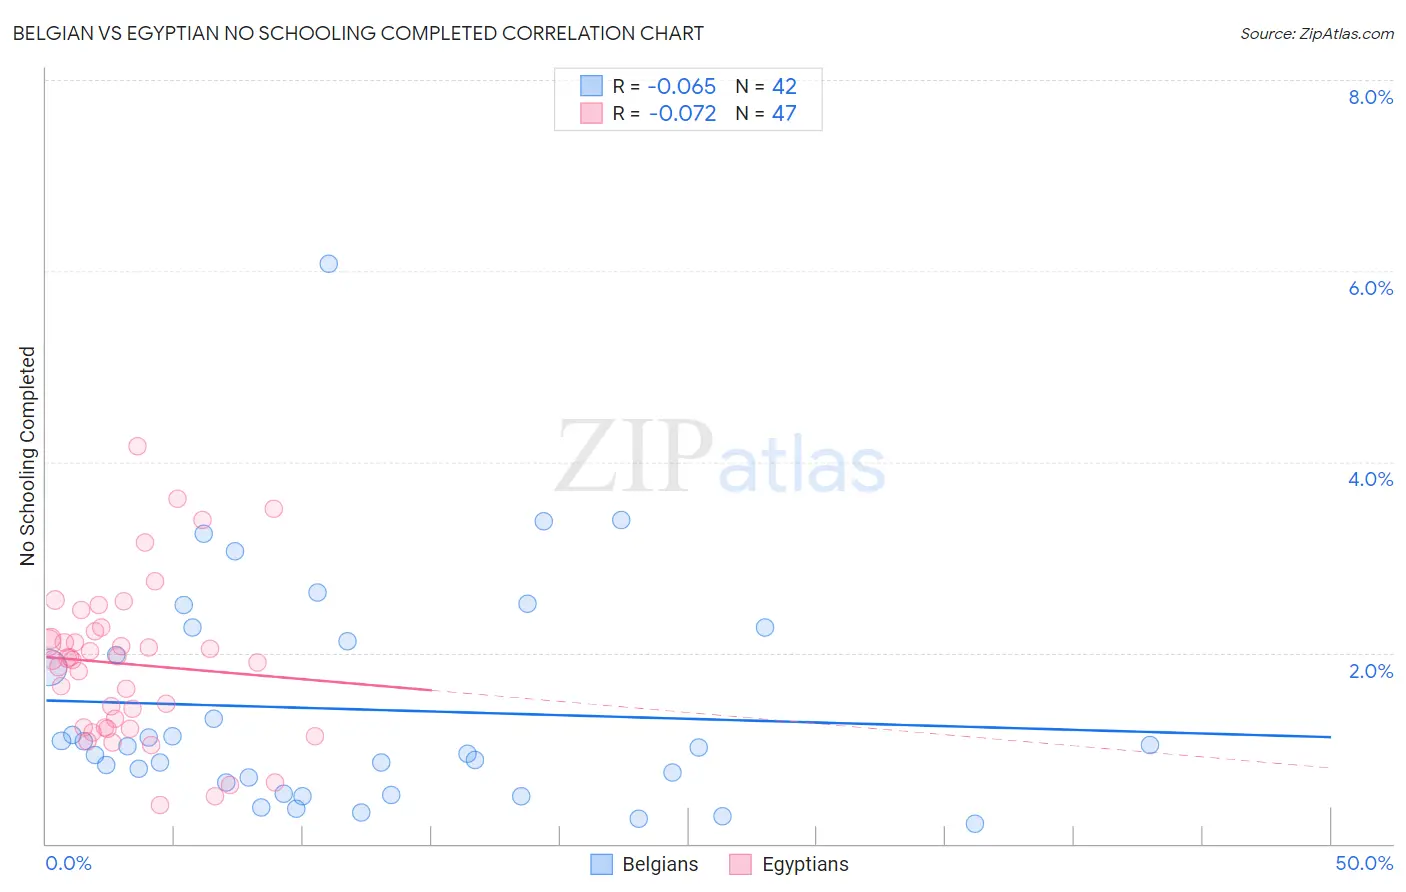
Belgian vs Egyptian No Schooling Completed Correlation Chart
The statistical analysis conducted on geographies consisting of 350,991,353 people shows a slight negative correlation between the proportion of Belgians and percentage of population with no schooling in the United States with a correlation coefficient (R) of -0.065 and weighted average of 1.6%. Similarly, the statistical analysis conducted on geographies consisting of 275,573,991 people shows a slight negative correlation between the proportion of Egyptians and percentage of population with no schooling in the United States with a correlation coefficient (R) of -0.072 and weighted average of 2.1%, a difference of 31.0%.
No Schooling Completed Correlation Summary
| Measurement | Belgian | Egyptian |
| Minimum | 0.22% | 0.40% |
| Maximum | 6.1% | 4.2% |
| Range | 5.9% | 3.8% |
| Mean | 1.4% | 1.9% |
| Median | 1.0% | 1.9% |
| Interquartile 25% (IQ1) | 0.64% | 1.2% |
| Interquartile 75% (IQ3) | 2.1% | 2.2% |
| Interquartile Range (IQR) | 1.5% | 1.0% |
| Standard Deviation (Sample) | 1.2% | 0.82% |
| Standard Deviation (Population) | 1.2% | 0.81% |
Similar Demographics by No Schooling Completed
Demographics Similar to Belgians by No Schooling Completed
In terms of no schooling completed, the demographic groups most similar to Belgians are Northern European (1.6%, a difference of 0.13%), Aleut (1.6%, a difference of 0.27%), Native Hawaiian (1.6%, a difference of 0.40%), Luxembourger (1.6%, a difference of 0.75%), and Hungarian (1.6%, a difference of 1.0%).
| Demographics | Rating | Rank | No Schooling Completed |
| British | 100.0 /100 | #30 | Exceptional 1.5% |
| Inupiat | 100.0 /100 | #31 | Exceptional 1.5% |
| Swiss | 100.0 /100 | #32 | Exceptional 1.5% |
| Italians | 100.0 /100 | #33 | Exceptional 1.5% |
| Latvians | 100.0 /100 | #34 | Exceptional 1.5% |
| Eastern Europeans | 100.0 /100 | #35 | Exceptional 1.6% |
| Aleuts | 99.9 /100 | #36 | Exceptional 1.6% |
| Belgians | 99.9 /100 | #37 | Exceptional 1.6% |
| Northern Europeans | 99.9 /100 | #38 | Exceptional 1.6% |
| Native Hawaiians | 99.9 /100 | #39 | Exceptional 1.6% |
| Luxembourgers | 99.9 /100 | #40 | Exceptional 1.6% |
| Hungarians | 99.9 /100 | #41 | Exceptional 1.6% |
| Bulgarians | 99.9 /100 | #42 | Exceptional 1.6% |
| Australians | 99.9 /100 | #43 | Exceptional 1.6% |
| Estonians | 99.9 /100 | #44 | Exceptional 1.6% |
Demographics Similar to Egyptians by No Schooling Completed
In terms of no schooling completed, the demographic groups most similar to Egyptians are Cheyenne (2.1%, a difference of 0.080%), Dutch West Indian (2.1%, a difference of 0.10%), Brazilian (2.1%, a difference of 0.15%), Comanche (2.1%, a difference of 0.21%), and Apache (2.1%, a difference of 0.35%).
| Demographics | Rating | Rank | No Schooling Completed |
| Kenyans | 65.7 /100 | #160 | Good 2.0% |
| Ugandans | 64.6 /100 | #161 | Good 2.0% |
| Immigrants | Brazil | 63.8 /100 | #162 | Good 2.1% |
| Albanians | 62.2 /100 | #163 | Good 2.1% |
| Comanche | 60.7 /100 | #164 | Good 2.1% |
| Brazilians | 60.2 /100 | #165 | Good 2.1% |
| Dutch West Indians | 59.9 /100 | #166 | Average 2.1% |
| Egyptians | 59.2 /100 | #167 | Average 2.1% |
| Cheyenne | 58.6 /100 | #168 | Average 2.1% |
| Apache | 56.7 /100 | #169 | Average 2.1% |
| Argentineans | 56.0 /100 | #170 | Average 2.1% |
| Immigrants | Poland | 55.2 /100 | #171 | Average 2.1% |
| Immigrants | Argentina | 52.7 /100 | #172 | Average 2.1% |
| Immigrants | Belarus | 51.8 /100 | #173 | Average 2.1% |
| Immigrants | Micronesia | 50.0 /100 | #174 | Average 2.1% |