Belgian vs Immigrants from China No Schooling Completed
COMPARE
Belgian
Immigrants from China
No Schooling Completed
No Schooling Completed Comparison
Belgians
Immigrants from China
1.6%
NO SCHOOLING COMPLETED
99.9/ 100
METRIC RATING
37th/ 347
METRIC RANK
2.6%
NO SCHOOLING COMPLETED
0.1/ 100
METRIC RATING
275th/ 347
METRIC RANK
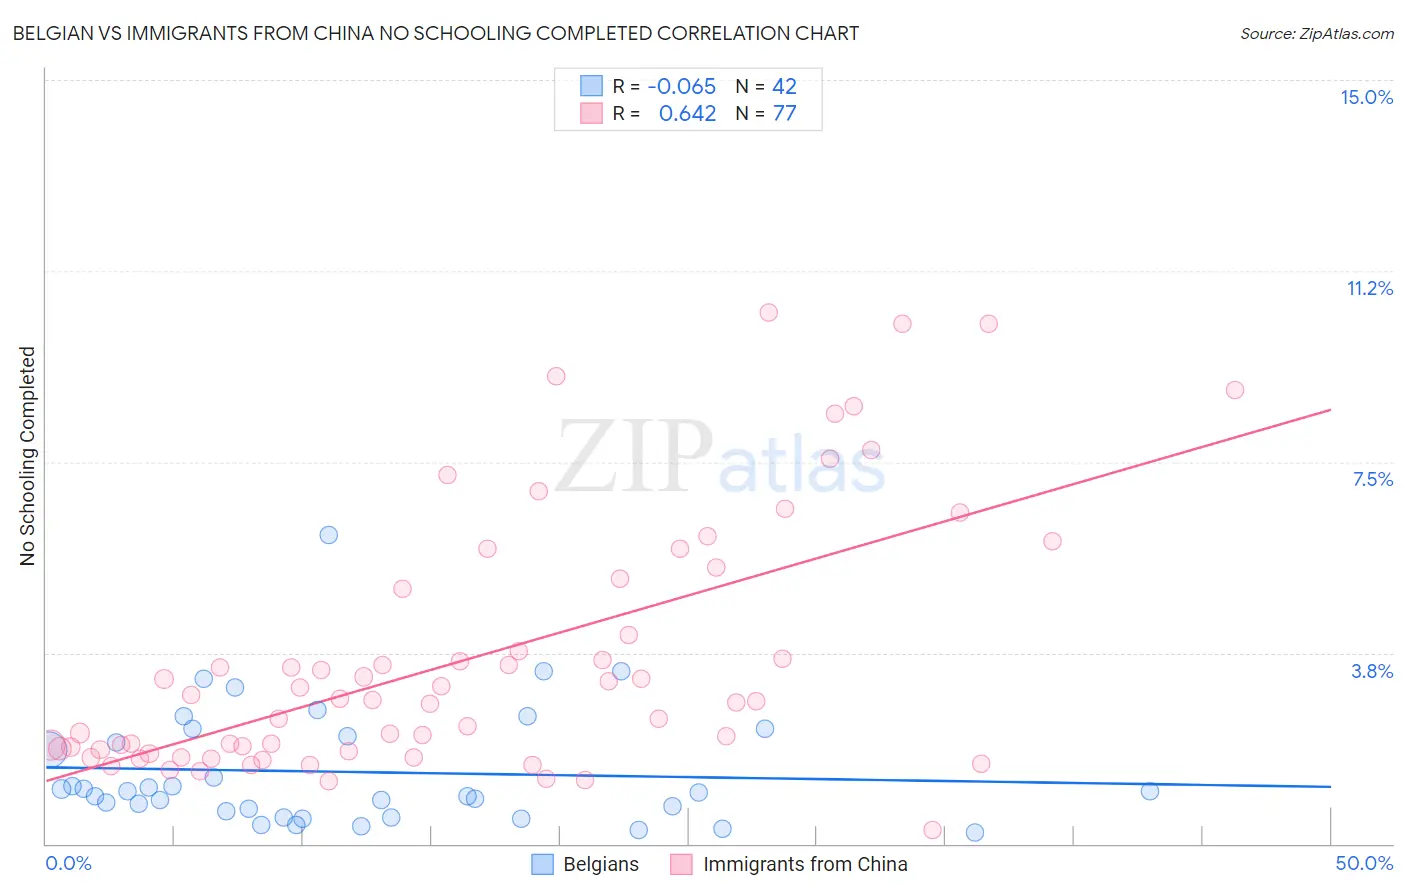
Belgian vs Immigrants from China No Schooling Completed Correlation Chart
The statistical analysis conducted on geographies consisting of 350,991,353 people shows a slight negative correlation between the proportion of Belgians and percentage of population with no schooling in the United States with a correlation coefficient (R) of -0.065 and weighted average of 1.6%. Similarly, the statistical analysis conducted on geographies consisting of 450,744,905 people shows a significant positive correlation between the proportion of Immigrants from China and percentage of population with no schooling in the United States with a correlation coefficient (R) of 0.642 and weighted average of 2.6%, a difference of 62.5%.
No Schooling Completed Correlation Summary
| Measurement | Belgian | Immigrants from China |
| Minimum | 0.22% | 0.26% |
| Maximum | 6.1% | 10.4% |
| Range | 5.9% | 10.2% |
| Mean | 1.4% | 3.6% |
| Median | 1.0% | 2.8% |
| Interquartile 25% (IQ1) | 0.64% | 1.8% |
| Interquartile 75% (IQ3) | 2.1% | 5.1% |
| Interquartile Range (IQR) | 1.5% | 3.3% |
| Standard Deviation (Sample) | 1.2% | 2.5% |
| Standard Deviation (Population) | 1.2% | 2.5% |
Similar Demographics by No Schooling Completed
Demographics Similar to Belgians by No Schooling Completed
In terms of no schooling completed, the demographic groups most similar to Belgians are Northern European (1.6%, a difference of 0.13%), Aleut (1.6%, a difference of 0.27%), Native Hawaiian (1.6%, a difference of 0.40%), Luxembourger (1.6%, a difference of 0.75%), and Hungarian (1.6%, a difference of 1.0%).
| Demographics | Rating | Rank | No Schooling Completed |
| British | 100.0 /100 | #30 | Exceptional 1.5% |
| Inupiat | 100.0 /100 | #31 | Exceptional 1.5% |
| Swiss | 100.0 /100 | #32 | Exceptional 1.5% |
| Italians | 100.0 /100 | #33 | Exceptional 1.5% |
| Latvians | 100.0 /100 | #34 | Exceptional 1.5% |
| Eastern Europeans | 100.0 /100 | #35 | Exceptional 1.6% |
| Aleuts | 99.9 /100 | #36 | Exceptional 1.6% |
| Belgians | 99.9 /100 | #37 | Exceptional 1.6% |
| Northern Europeans | 99.9 /100 | #38 | Exceptional 1.6% |
| Native Hawaiians | 99.9 /100 | #39 | Exceptional 1.6% |
| Luxembourgers | 99.9 /100 | #40 | Exceptional 1.6% |
| Hungarians | 99.9 /100 | #41 | Exceptional 1.6% |
| Bulgarians | 99.9 /100 | #42 | Exceptional 1.6% |
| Australians | 99.9 /100 | #43 | Exceptional 1.6% |
| Estonians | 99.9 /100 | #44 | Exceptional 1.6% |
Demographics Similar to Immigrants from China by No Schooling Completed
In terms of no schooling completed, the demographic groups most similar to Immigrants from China are Ghanaian (2.6%, a difference of 0.18%), Immigrants from Cameroon (2.5%, a difference of 0.56%), Immigrants from Western Africa (2.6%, a difference of 0.56%), Immigrants from Philippines (2.6%, a difference of 0.61%), and Immigrants from Uzbekistan (2.6%, a difference of 0.81%).
| Demographics | Rating | Rank | No Schooling Completed |
| Taiwanese | 0.3 /100 | #268 | Tragic 2.5% |
| Immigrants | Nigeria | 0.2 /100 | #269 | Tragic 2.5% |
| Immigrants | Peru | 0.2 /100 | #270 | Tragic 2.5% |
| Cubans | 0.2 /100 | #271 | Tragic 2.5% |
| Immigrants | Bolivia | 0.2 /100 | #272 | Tragic 2.5% |
| Immigrants | Cameroon | 0.1 /100 | #273 | Tragic 2.5% |
| Ghanaians | 0.1 /100 | #274 | Tragic 2.6% |
| Immigrants | China | 0.1 /100 | #275 | Tragic 2.6% |
| Immigrants | Western Africa | 0.1 /100 | #276 | Tragic 2.6% |
| Immigrants | Philippines | 0.1 /100 | #277 | Tragic 2.6% |
| Immigrants | Uzbekistan | 0.1 /100 | #278 | Tragic 2.6% |
| Barbadians | 0.1 /100 | #279 | Tragic 2.6% |
| Trinidadians and Tobagonians | 0.1 /100 | #280 | Tragic 2.6% |
| Afghans | 0.1 /100 | #281 | Tragic 2.6% |
| Immigrants | Ghana | 0.1 /100 | #282 | Tragic 2.6% |