Immigrants from Cabo Verde vs Slavic Master's Degree
COMPARE
Immigrants from Cabo Verde
Slavic
Master's Degree
Master's Degree Comparison
Immigrants from Cabo Verde
Slavs
11.3%
MASTER'S DEGREE
0.1/ 100
METRIC RATING
304th/ 347
METRIC RANK
15.5%
MASTER'S DEGREE
77.0/ 100
METRIC RATING
152nd/ 347
METRIC RANK
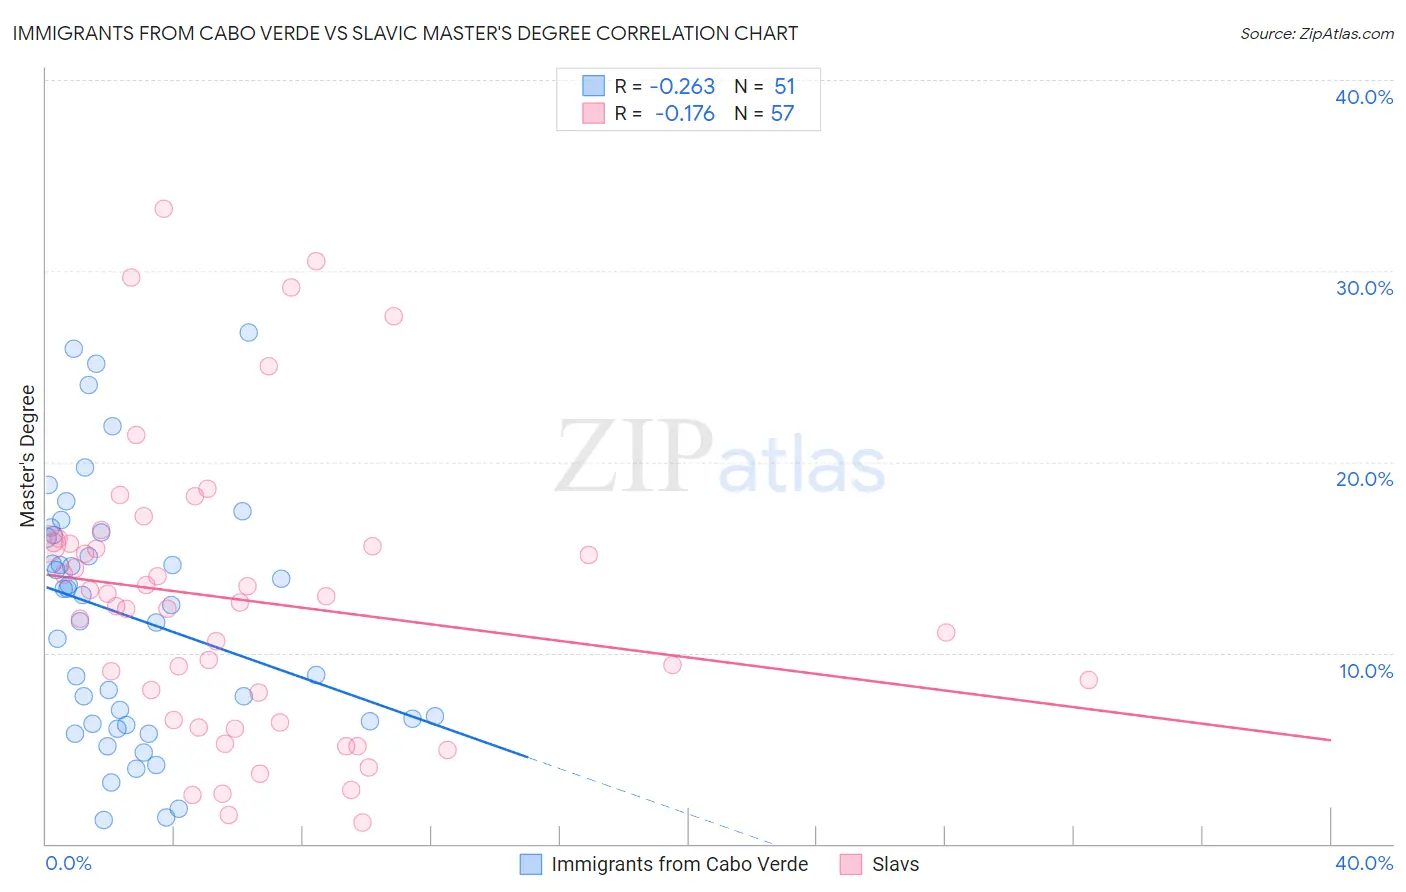
Immigrants from Cabo Verde vs Slavic Master's Degree Correlation Chart
The statistical analysis conducted on geographies consisting of 38,158,316 people shows a weak negative correlation between the proportion of Immigrants from Cabo Verde and percentage of population with at least master's degree education in the United States with a correlation coefficient (R) of -0.263 and weighted average of 11.3%. Similarly, the statistical analysis conducted on geographies consisting of 270,833,952 people shows a poor negative correlation between the proportion of Slavs and percentage of population with at least master's degree education in the United States with a correlation coefficient (R) of -0.176 and weighted average of 15.5%, a difference of 36.6%.
Master's Degree Correlation Summary
| Measurement | Immigrants from Cabo Verde | Slavic |
| Minimum | 1.2% | 1.1% |
| Maximum | 26.8% | 33.2% |
| Range | 25.5% | 32.1% |
| Mean | 11.9% | 12.8% |
| Median | 12.5% | 12.6% |
| Interquartile 25% (IQ1) | 6.3% | 6.4% |
| Interquartile 75% (IQ3) | 16.1% | 15.7% |
| Interquartile Range (IQR) | 9.8% | 9.3% |
| Standard Deviation (Sample) | 6.6% | 7.5% |
| Standard Deviation (Population) | 6.5% | 7.5% |
Similar Demographics by Master's Degree
Demographics Similar to Immigrants from Cabo Verde by Master's Degree
In terms of master's degree, the demographic groups most similar to Immigrants from Cabo Verde are Immigrants from Laos (11.4%, a difference of 0.19%), Cherokee (11.4%, a difference of 0.21%), Tsimshian (11.4%, a difference of 0.52%), Immigrants from Latin America (11.3%, a difference of 0.65%), and Chippewa (11.4%, a difference of 0.68%).
| Demographics | Rating | Rank | Master's Degree |
| Immigrants | Yemen | 0.1 /100 | #297 | Tragic 11.6% |
| Samoans | 0.1 /100 | #298 | Tragic 11.5% |
| Chickasaw | 0.1 /100 | #299 | Tragic 11.4% |
| Chippewa | 0.1 /100 | #300 | Tragic 11.4% |
| Tsimshian | 0.1 /100 | #301 | Tragic 11.4% |
| Cherokee | 0.1 /100 | #302 | Tragic 11.4% |
| Immigrants | Laos | 0.1 /100 | #303 | Tragic 11.4% |
| Immigrants | Cabo Verde | 0.1 /100 | #304 | Tragic 11.3% |
| Immigrants | Latin America | 0.0 /100 | #305 | Tragic 11.3% |
| Mexican American Indians | 0.0 /100 | #306 | Tragic 11.2% |
| Cheyenne | 0.0 /100 | #307 | Tragic 11.2% |
| Puerto Ricans | 0.0 /100 | #308 | Tragic 11.2% |
| Puget Sound Salish | 0.0 /100 | #309 | Tragic 11.1% |
| Shoshone | 0.0 /100 | #310 | Tragic 11.1% |
| Seminole | 0.0 /100 | #311 | Tragic 11.0% |
Demographics Similar to Slavs by Master's Degree
In terms of master's degree, the demographic groups most similar to Slavs are Icelander (15.5%, a difference of 0.030%), Iraqi (15.5%, a difference of 0.050%), Immigrants from South America (15.5%, a difference of 0.12%), Immigrants from Bangladesh (15.5%, a difference of 0.16%), and Slovene (15.5%, a difference of 0.17%).
| Demographics | Rating | Rank | Master's Degree |
| South Americans | 81.3 /100 | #145 | Excellent 15.6% |
| Immigrants | Afghanistan | 79.4 /100 | #146 | Good 15.6% |
| Hungarians | 79.1 /100 | #147 | Good 15.6% |
| Immigrants | Senegal | 78.2 /100 | #148 | Good 15.5% |
| Ghanaians | 78.2 /100 | #149 | Good 15.5% |
| Slovenes | 78.0 /100 | #150 | Good 15.5% |
| Iraqis | 77.3 /100 | #151 | Good 15.5% |
| Slavs | 77.0 /100 | #152 | Good 15.5% |
| Icelanders | 76.8 /100 | #153 | Good 15.5% |
| Immigrants | South America | 76.3 /100 | #154 | Good 15.5% |
| Immigrants | Bangladesh | 76.1 /100 | #155 | Good 15.5% |
| Bermudans | 73.9 /100 | #156 | Good 15.4% |
| Immigrants | Cameroon | 71.7 /100 | #157 | Good 15.4% |
| Immigrants | Poland | 71.5 /100 | #158 | Good 15.4% |
| Luxembourgers | 71.0 /100 | #159 | Good 15.3% |