Immigrants from Kazakhstan vs Laotian College, 1 year or more
COMPARE
Immigrants from Kazakhstan
Laotian
College, 1 year or more
College, 1 year or more Comparison
Immigrants from Kazakhstan
Laotians
63.6%
COLLEGE, 1 YEAR OR MORE
99.5/ 100
METRIC RATING
60th/ 347
METRIC RANK
62.8%
COLLEGE, 1 YEAR OR MORE
98.7/ 100
METRIC RATING
81st/ 347
METRIC RANK
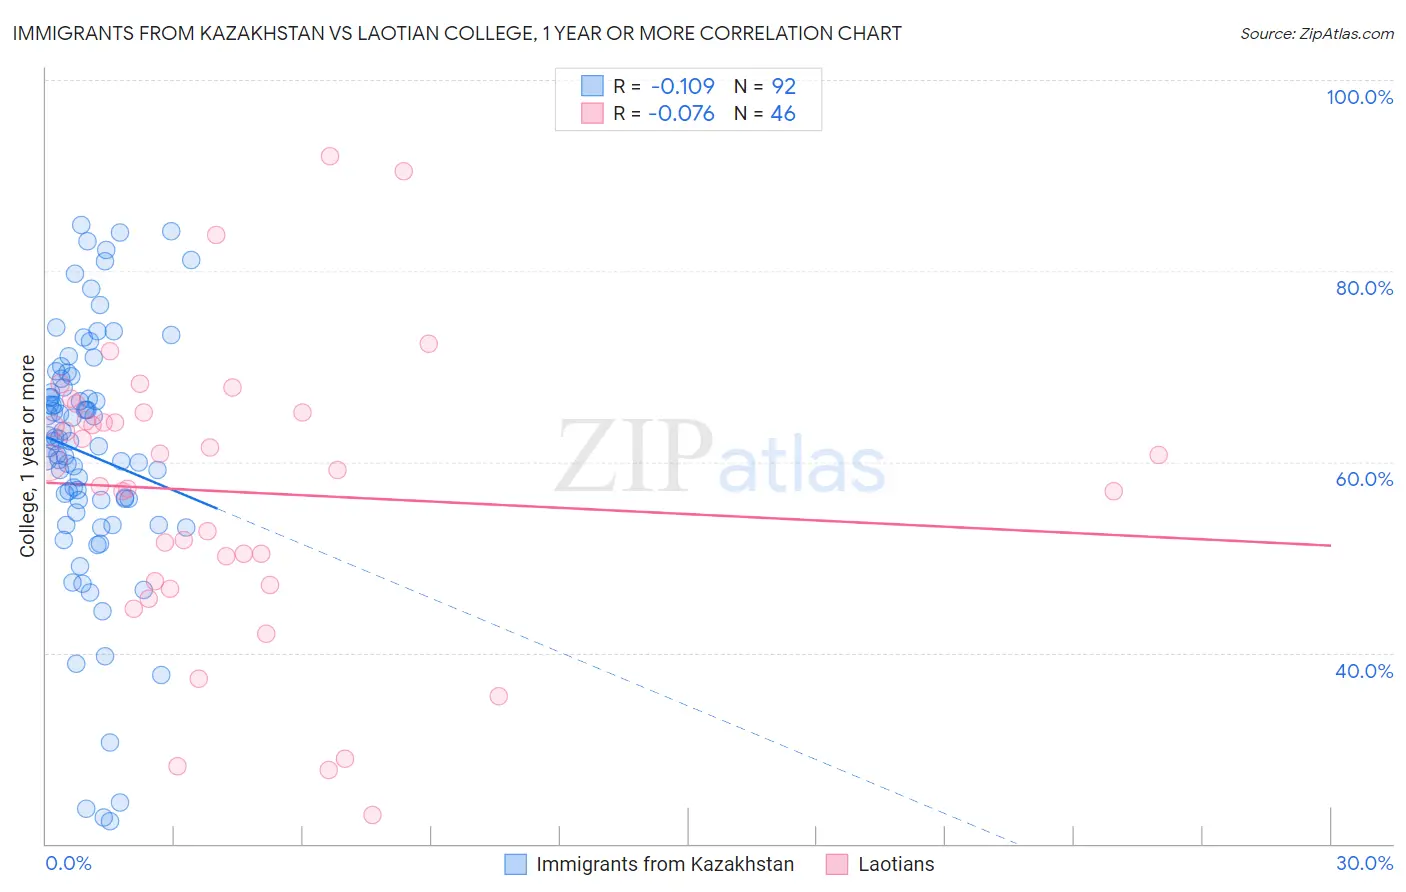
Immigrants from Kazakhstan vs Laotian College, 1 year or more Correlation Chart
The statistical analysis conducted on geographies consisting of 124,444,189 people shows a poor negative correlation between the proportion of Immigrants from Kazakhstan and percentage of population with at least college, 1 year or more education in the United States with a correlation coefficient (R) of -0.109 and weighted average of 63.6%. Similarly, the statistical analysis conducted on geographies consisting of 224,861,279 people shows a slight negative correlation between the proportion of Laotians and percentage of population with at least college, 1 year or more education in the United States with a correlation coefficient (R) of -0.076 and weighted average of 62.8%, a difference of 1.2%.
College, 1 year or more Correlation Summary
| Measurement | Immigrants from Kazakhstan | Laotian |
| Minimum | 22.3% | 23.0% |
| Maximum | 84.8% | 92.1% |
| Range | 62.5% | 69.0% |
| Mean | 60.8% | 56.9% |
| Median | 62.1% | 59.6% |
| Interquartile 25% (IQ1) | 55.3% | 47.5% |
| Interquartile 75% (IQ3) | 68.2% | 65.1% |
| Interquartile Range (IQR) | 12.9% | 17.7% |
| Standard Deviation (Sample) | 13.4% | 15.0% |
| Standard Deviation (Population) | 13.3% | 14.8% |
Similar Demographics by College, 1 year or more
Demographics Similar to Immigrants from Kazakhstan by College, 1 year or more
In terms of college, 1 year or more, the demographic groups most similar to Immigrants from Kazakhstan are Bolivian (63.5%, a difference of 0.10%), Immigrants from Indonesia (63.5%, a difference of 0.12%), Immigrants from Scotland (63.4%, a difference of 0.25%), Immigrants from Serbia (63.8%, a difference of 0.27%), and Immigrants from Spain (63.4%, a difference of 0.28%).
| Demographics | Rating | Rank | College, 1 year or more |
| Asians | 99.8 /100 | #53 | Exceptional 64.2% |
| Zimbabweans | 99.8 /100 | #54 | Exceptional 64.2% |
| Immigrants | Belarus | 99.7 /100 | #55 | Exceptional 64.1% |
| Immigrants | Czechoslovakia | 99.7 /100 | #56 | Exceptional 64.1% |
| South Africans | 99.7 /100 | #57 | Exceptional 64.1% |
| Immigrants | Asia | 99.7 /100 | #58 | Exceptional 64.0% |
| Immigrants | Serbia | 99.6 /100 | #59 | Exceptional 63.8% |
| Immigrants | Kazakhstan | 99.5 /100 | #60 | Exceptional 63.6% |
| Bolivians | 99.5 /100 | #61 | Exceptional 63.5% |
| Immigrants | Indonesia | 99.5 /100 | #62 | Exceptional 63.5% |
| Immigrants | Scotland | 99.4 /100 | #63 | Exceptional 63.4% |
| Immigrants | Spain | 99.4 /100 | #64 | Exceptional 63.4% |
| Maltese | 99.3 /100 | #65 | Exceptional 63.4% |
| Immigrants | Europe | 99.3 /100 | #66 | Exceptional 63.3% |
| Immigrants | Romania | 99.3 /100 | #67 | Exceptional 63.3% |
Demographics Similar to Laotians by College, 1 year or more
In terms of college, 1 year or more, the demographic groups most similar to Laotians are Immigrants from Bolivia (62.8%, a difference of 0.050%), Lithuanian (62.9%, a difference of 0.060%), Immigrants from Argentina (62.8%, a difference of 0.080%), Northern European (62.9%, a difference of 0.090%), and Immigrants from Lebanon (62.9%, a difference of 0.11%).
| Demographics | Rating | Rank | College, 1 year or more |
| Immigrants | North America | 99.0 /100 | #74 | Exceptional 63.0% |
| Armenians | 98.9 /100 | #75 | Exceptional 63.0% |
| Paraguayans | 98.8 /100 | #76 | Exceptional 62.9% |
| Ethiopians | 98.8 /100 | #77 | Exceptional 62.9% |
| Immigrants | Lebanon | 98.8 /100 | #78 | Exceptional 62.9% |
| Northern Europeans | 98.8 /100 | #79 | Exceptional 62.9% |
| Lithuanians | 98.8 /100 | #80 | Exceptional 62.9% |
| Laotians | 98.7 /100 | #81 | Exceptional 62.8% |
| Immigrants | Bolivia | 98.7 /100 | #82 | Exceptional 62.8% |
| Immigrants | Argentina | 98.6 /100 | #83 | Exceptional 62.8% |
| Immigrants | England | 98.6 /100 | #84 | Exceptional 62.8% |
| Immigrants | Pakistan | 98.6 /100 | #85 | Exceptional 62.8% |
| Immigrants | Western Europe | 98.6 /100 | #86 | Exceptional 62.7% |
| Immigrants | Hungary | 98.6 /100 | #87 | Exceptional 62.7% |
| Greeks | 98.3 /100 | #88 | Exceptional 62.6% |