Barbadian vs Immigrants from Albania College, 1 year or more
COMPARE
Barbadian
Immigrants from Albania
College, 1 year or more
College, 1 year or more Comparison
Barbadians
Immigrants from Albania
56.0%
COLLEGE, 1 YEAR OR MORE
1.3/ 100
METRIC RATING
238th/ 347
METRIC RANK
59.5%
COLLEGE, 1 YEAR OR MORE
52.3/ 100
METRIC RATING
171st/ 347
METRIC RANK
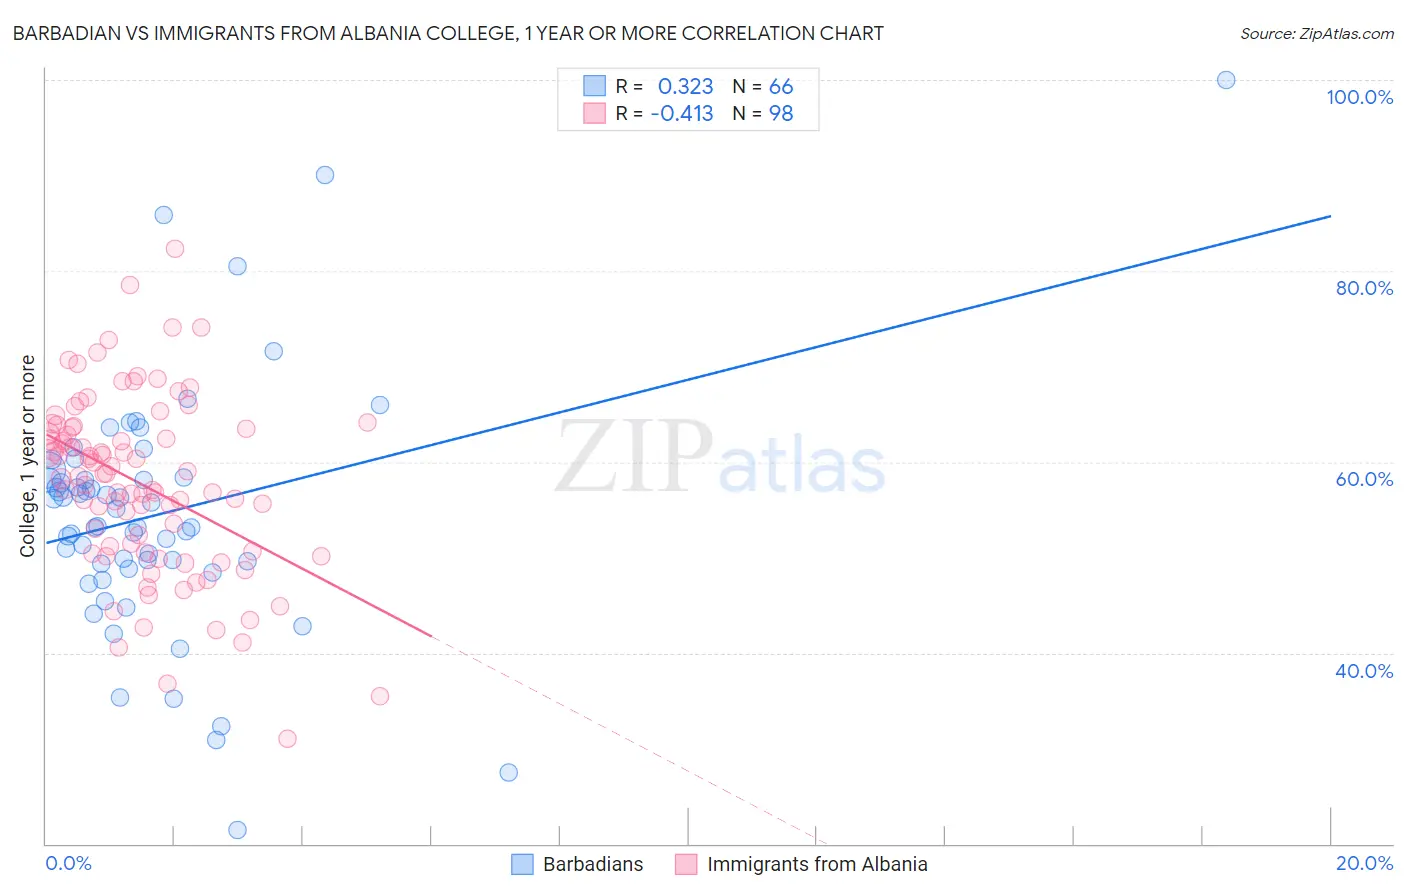
Barbadian vs Immigrants from Albania College, 1 year or more Correlation Chart
The statistical analysis conducted on geographies consisting of 141,304,122 people shows a mild positive correlation between the proportion of Barbadians and percentage of population with at least college, 1 year or more education in the United States with a correlation coefficient (R) of 0.323 and weighted average of 56.0%. Similarly, the statistical analysis conducted on geographies consisting of 119,397,636 people shows a moderate negative correlation between the proportion of Immigrants from Albania and percentage of population with at least college, 1 year or more education in the United States with a correlation coefficient (R) of -0.413 and weighted average of 59.5%, a difference of 6.2%.
College, 1 year or more Correlation Summary
| Measurement | Barbadian | Immigrants from Albania |
| Minimum | 21.4% | 31.0% |
| Maximum | 100.0% | 82.3% |
| Range | 78.6% | 51.3% |
| Mean | 54.5% | 57.7% |
| Median | 54.2% | 58.6% |
| Interquartile 25% (IQ1) | 49.4% | 50.6% |
| Interquartile 75% (IQ3) | 58.3% | 63.6% |
| Interquartile Range (IQR) | 8.9% | 12.9% |
| Standard Deviation (Sample) | 13.0% | 9.4% |
| Standard Deviation (Population) | 12.9% | 9.3% |
Similar Demographics by College, 1 year or more
Demographics Similar to Barbadians by College, 1 year or more
In terms of college, 1 year or more, the demographic groups most similar to Barbadians are Puget Sound Salish (55.9%, a difference of 0.20%), Samoan (56.2%, a difference of 0.27%), Trinidadian and Tobagonian (55.8%, a difference of 0.30%), French American Indian (55.8%, a difference of 0.34%), and Iroquois (56.2%, a difference of 0.38%).
| Demographics | Rating | Rank | College, 1 year or more |
| Immigrants | Burma/Myanmar | 2.7 /100 | #231 | Tragic 56.6% |
| Immigrants | Bangladesh | 2.6 /100 | #232 | Tragic 56.6% |
| Immigrants | Nonimmigrants | 2.5 /100 | #233 | Tragic 56.5% |
| Spanish Americans | 1.8 /100 | #234 | Tragic 56.3% |
| West Indians | 1.8 /100 | #235 | Tragic 56.3% |
| Iroquois | 1.7 /100 | #236 | Tragic 56.2% |
| Samoans | 1.6 /100 | #237 | Tragic 56.2% |
| Barbadians | 1.3 /100 | #238 | Tragic 56.0% |
| Puget Sound Salish | 1.1 /100 | #239 | Tragic 55.9% |
| Trinidadians and Tobagonians | 1.1 /100 | #240 | Tragic 55.8% |
| French American Indians | 1.0 /100 | #241 | Tragic 55.8% |
| Marshallese | 1.0 /100 | #242 | Tragic 55.8% |
| Osage | 1.0 /100 | #243 | Tragic 55.8% |
| Chippewa | 0.9 /100 | #244 | Tragic 55.7% |
| Immigrants | Liberia | 0.8 /100 | #245 | Tragic 55.7% |
Demographics Similar to Immigrants from Albania by College, 1 year or more
In terms of college, 1 year or more, the demographic groups most similar to Immigrants from Albania are Welsh (59.5%, a difference of 0.0%), Immigrants from Sierra Leone (59.5%, a difference of 0.010%), Immigrants from Southern Europe (59.5%, a difference of 0.020%), Hungarian (59.5%, a difference of 0.030%), and Immigrants from North Macedonia (59.5%, a difference of 0.040%).
| Demographics | Rating | Rank | College, 1 year or more |
| Belgians | 58.1 /100 | #164 | Average 59.7% |
| Irish | 56.1 /100 | #165 | Average 59.6% |
| Immigrants | Africa | 56.1 /100 | #166 | Average 59.6% |
| Immigrants | North Macedonia | 53.1 /100 | #167 | Average 59.5% |
| Hungarians | 52.9 /100 | #168 | Average 59.5% |
| Immigrants | Southern Europe | 52.7 /100 | #169 | Average 59.5% |
| Welsh | 52.4 /100 | #170 | Average 59.5% |
| Immigrants | Albania | 52.3 /100 | #171 | Average 59.5% |
| Immigrants | Sierra Leone | 52.2 /100 | #172 | Average 59.5% |
| Immigrants | Oceania | 51.2 /100 | #173 | Average 59.4% |
| Celtics | 50.0 /100 | #174 | Average 59.4% |
| Sri Lankans | 49.0 /100 | #175 | Average 59.4% |
| Immigrants | Poland | 48.9 /100 | #176 | Average 59.4% |
| Tlingit-Haida | 48.4 /100 | #177 | Average 59.4% |
| Czechoslovakians | 48.3 /100 | #178 | Average 59.4% |