Barbadian vs Immigrants from Oceania 11th Grade
COMPARE
Barbadian
Immigrants from Oceania
11th Grade
11th Grade Comparison
Barbadians
Immigrants from Oceania
90.8%
11TH GRADE
0.0/ 100
METRIC RATING
279th/ 347
METRIC RANK
92.2%
11TH GRADE
22.4/ 100
METRIC RATING
207th/ 347
METRIC RANK
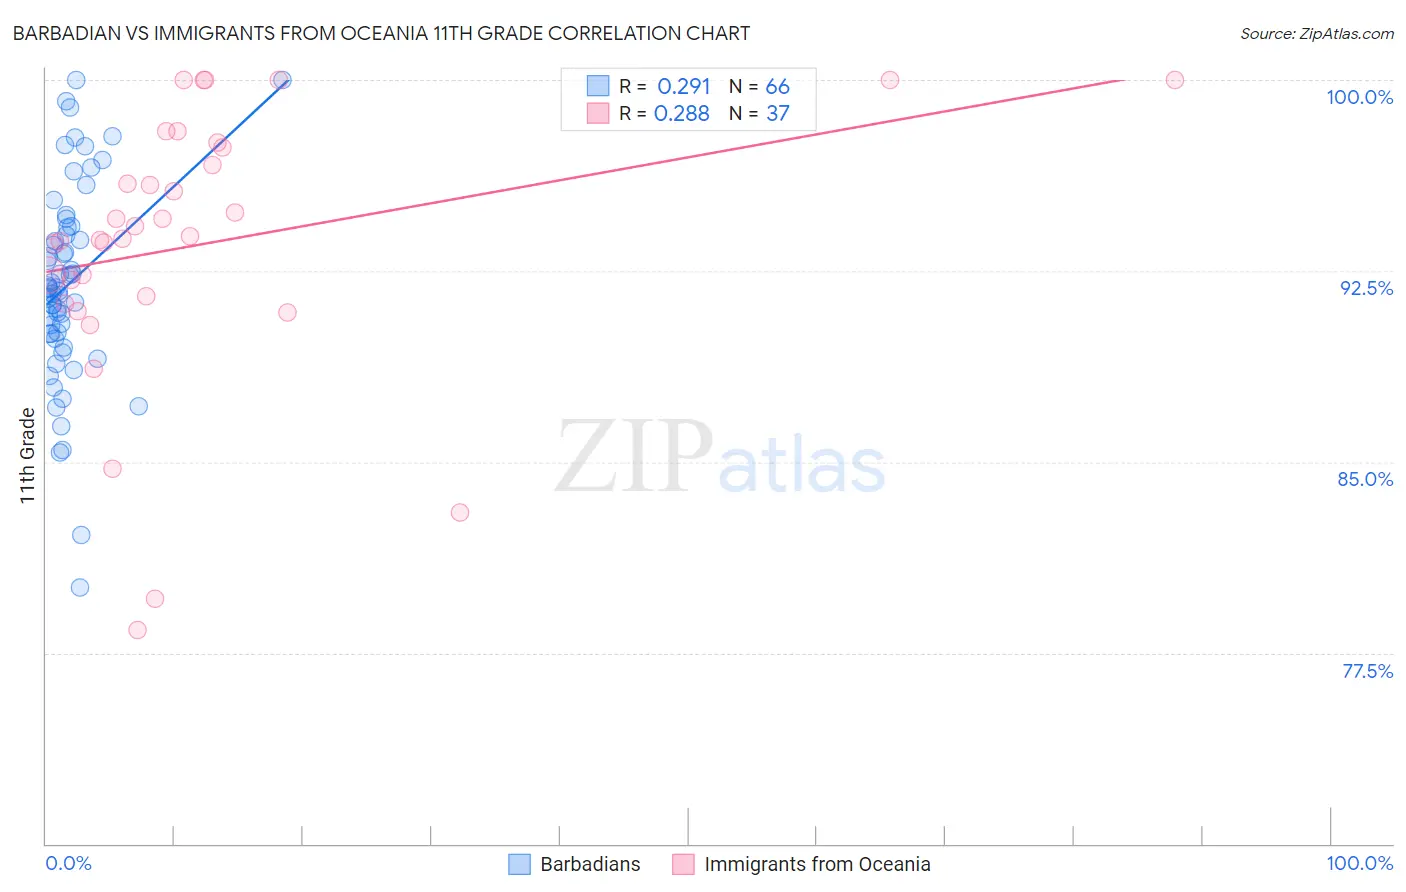
Barbadian vs Immigrants from Oceania 11th Grade Correlation Chart
The statistical analysis conducted on geographies consisting of 141,304,456 people shows a weak positive correlation between the proportion of Barbadians and percentage of population with at least 11th grade education in the United States with a correlation coefficient (R) of 0.291 and weighted average of 90.8%. Similarly, the statistical analysis conducted on geographies consisting of 305,521,521 people shows a weak positive correlation between the proportion of Immigrants from Oceania and percentage of population with at least 11th grade education in the United States with a correlation coefficient (R) of 0.288 and weighted average of 92.2%, a difference of 1.6%.
11th Grade Correlation Summary
| Measurement | Barbadian | Immigrants from Oceania |
| Minimum | 80.1% | 78.4% |
| Maximum | 100.0% | 100.0% |
| Range | 19.9% | 21.6% |
| Mean | 92.0% | 93.6% |
| Median | 91.8% | 93.8% |
| Interquartile 25% (IQ1) | 90.0% | 91.4% |
| Interquartile 75% (IQ3) | 94.2% | 97.5% |
| Interquartile Range (IQR) | 4.2% | 6.1% |
| Standard Deviation (Sample) | 3.9% | 5.3% |
| Standard Deviation (Population) | 3.9% | 5.3% |
Similar Demographics by 11th Grade
Demographics Similar to Barbadians by 11th Grade
In terms of 11th grade, the demographic groups most similar to Barbadians are Malaysian (90.8%, a difference of 0.040%), Sri Lankan (90.7%, a difference of 0.060%), Immigrants from Congo (90.9%, a difference of 0.080%), Bangladeshi (90.9%, a difference of 0.10%), and Dutch West Indian (90.7%, a difference of 0.12%).
| Demographics | Rating | Rank | 11th Grade |
| West Indians | 0.1 /100 | #272 | Tragic 91.0% |
| Paiute | 0.1 /100 | #273 | Tragic 91.0% |
| Immigrants | Trinidad and Tobago | 0.1 /100 | #274 | Tragic 90.9% |
| Immigrants | South Eastern Asia | 0.1 /100 | #275 | Tragic 90.9% |
| Bangladeshis | 0.1 /100 | #276 | Tragic 90.9% |
| Immigrants | Congo | 0.1 /100 | #277 | Tragic 90.9% |
| Malaysians | 0.1 /100 | #278 | Tragic 90.8% |
| Barbadians | 0.0 /100 | #279 | Tragic 90.8% |
| Sri Lankans | 0.0 /100 | #280 | Tragic 90.7% |
| Dutch West Indians | 0.0 /100 | #281 | Tragic 90.7% |
| Immigrants | St. Vincent and the Grenadines | 0.0 /100 | #282 | Tragic 90.7% |
| Immigrants | Barbados | 0.0 /100 | #283 | Tragic 90.7% |
| Immigrants | Laos | 0.0 /100 | #284 | Tragic 90.5% |
| Immigrants | Burma/Myanmar | 0.0 /100 | #285 | Tragic 90.4% |
| Immigrants | West Indies | 0.0 /100 | #286 | Tragic 90.4% |
Demographics Similar to Immigrants from Oceania by 11th Grade
In terms of 11th grade, the demographic groups most similar to Immigrants from Oceania are Immigrants from Sudan (92.3%, a difference of 0.010%), Immigrants from Hong Kong (92.2%, a difference of 0.010%), Kiowa (92.2%, a difference of 0.010%), Bolivian (92.2%, a difference of 0.010%), and Colville (92.2%, a difference of 0.010%).
| Demographics | Rating | Rank | 11th Grade |
| Samoans | 25.1 /100 | #200 | Fair 92.3% |
| Immigrants | China | 25.1 /100 | #201 | Fair 92.3% |
| Immigrants | Eastern Africa | 24.1 /100 | #202 | Fair 92.3% |
| Immigrants | Sudan | 23.5 /100 | #203 | Fair 92.3% |
| Immigrants | Hong Kong | 23.3 /100 | #204 | Fair 92.2% |
| Kiowa | 23.2 /100 | #205 | Fair 92.2% |
| Bolivians | 23.2 /100 | #206 | Fair 92.2% |
| Immigrants | Oceania | 22.4 /100 | #207 | Fair 92.2% |
| Colville | 21.8 /100 | #208 | Fair 92.2% |
| Tongans | 19.8 /100 | #209 | Poor 92.2% |
| Ethiopians | 18.8 /100 | #210 | Poor 92.2% |
| Immigrants | Micronesia | 17.7 /100 | #211 | Poor 92.2% |
| Koreans | 14.4 /100 | #212 | Poor 92.1% |
| Immigrants | Ethiopia | 13.9 /100 | #213 | Poor 92.1% |
| Afghans | 12.8 /100 | #214 | Poor 92.1% |