Barbadian vs Immigrants from Oceania Unemployment Among Ages 45 to 54 years
COMPARE
Barbadian
Immigrants from Oceania
Unemployment Among Ages 45 to 54 years
Unemployment Among Ages 45 to 54 years Comparison
Barbadians
Immigrants from Oceania
5.5%
UNEMPLOYMENT AMONG AGES 45 TO 54 YEARS
0.0/ 100
METRIC RATING
309th/ 347
METRIC RANK
4.4%
UNEMPLOYMENT AMONG AGES 45 TO 54 YEARS
89.5/ 100
METRIC RATING
121st/ 347
METRIC RANK
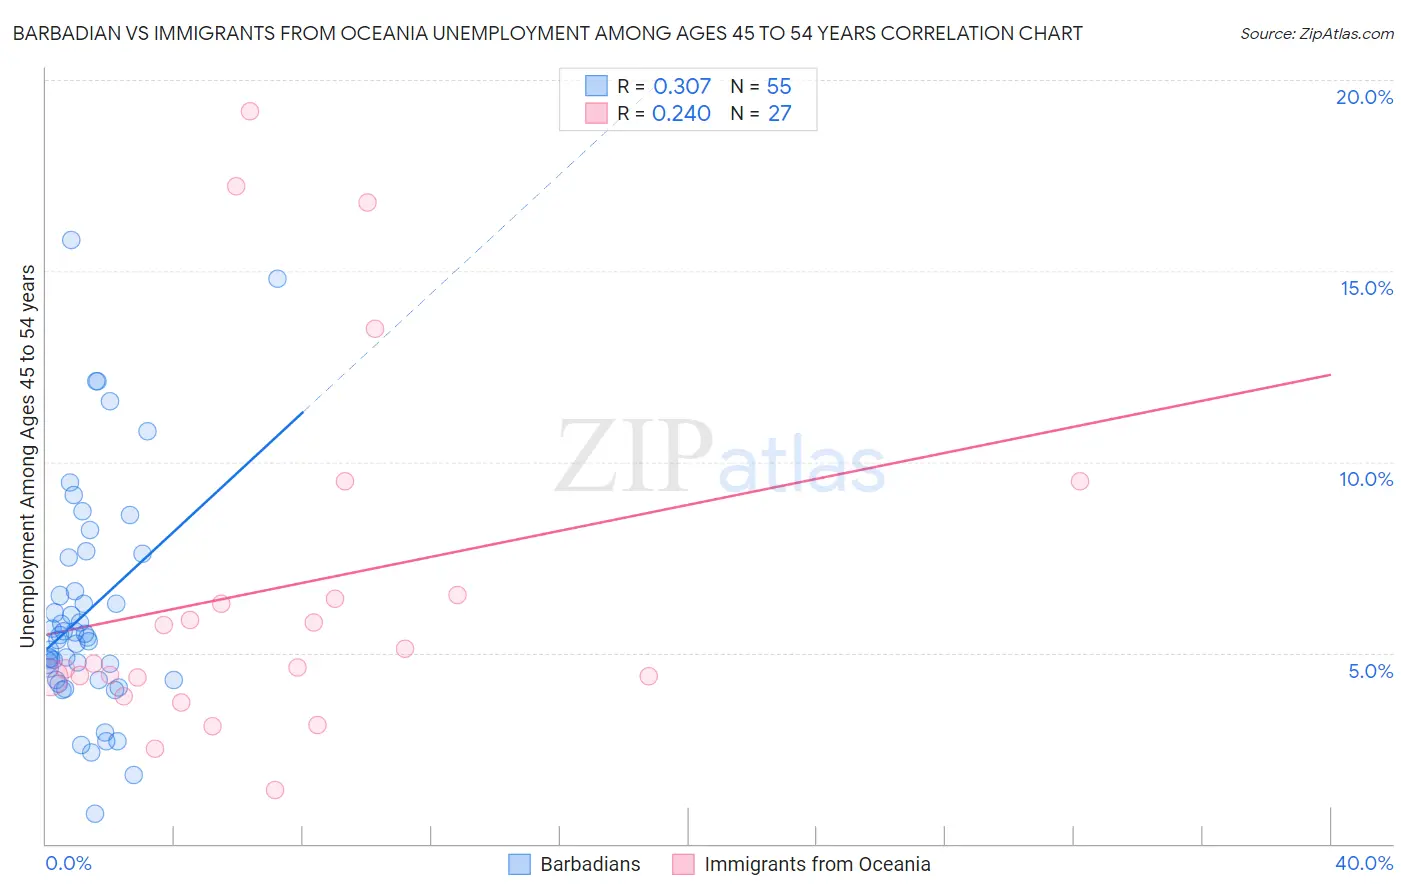
Barbadian vs Immigrants from Oceania Unemployment Among Ages 45 to 54 years Correlation Chart
The statistical analysis conducted on geographies consisting of 140,224,608 people shows a mild positive correlation between the proportion of Barbadians and unemployment rate among population between the ages 45 and 54 in the United States with a correlation coefficient (R) of 0.307 and weighted average of 5.5%. Similarly, the statistical analysis conducted on geographies consisting of 299,308,619 people shows a weak positive correlation between the proportion of Immigrants from Oceania and unemployment rate among population between the ages 45 and 54 in the United States with a correlation coefficient (R) of 0.240 and weighted average of 4.4%, a difference of 23.9%.
Unemployment Among Ages 45 to 54 years Correlation Summary
| Measurement | Barbadian | Immigrants from Oceania |
| Minimum | 0.80% | 1.4% |
| Maximum | 15.8% | 19.2% |
| Range | 15.0% | 17.8% |
| Mean | 6.1% | 6.7% |
| Median | 5.4% | 4.7% |
| Interquartile 25% (IQ1) | 4.3% | 4.3% |
| Interquartile 75% (IQ3) | 7.5% | 6.5% |
| Interquartile Range (IQR) | 3.2% | 2.2% |
| Standard Deviation (Sample) | 3.0% | 4.7% |
| Standard Deviation (Population) | 3.0% | 4.6% |
Similar Demographics by Unemployment Among Ages 45 to 54 years
Demographics Similar to Barbadians by Unemployment Among Ages 45 to 54 years
In terms of unemployment among ages 45 to 54 years, the demographic groups most similar to Barbadians are Immigrants from Barbados (5.5%, a difference of 0.15%), Chippewa (5.5%, a difference of 0.44%), Black/African American (5.4%, a difference of 0.65%), Vietnamese (5.4%, a difference of 1.4%), and Immigrants from Bangladesh (5.4%, a difference of 1.7%).
| Demographics | Rating | Rank | Unemployment Among Ages 45 to 54 years |
| Immigrants | Ecuador | 0.0 /100 | #302 | Tragic 5.3% |
| Immigrants | Belize | 0.0 /100 | #303 | Tragic 5.3% |
| Immigrants | Jamaica | 0.0 /100 | #304 | Tragic 5.4% |
| Immigrants | West Indies | 0.0 /100 | #305 | Tragic 5.4% |
| Immigrants | Bangladesh | 0.0 /100 | #306 | Tragic 5.4% |
| Vietnamese | 0.0 /100 | #307 | Tragic 5.4% |
| Blacks/African Americans | 0.0 /100 | #308 | Tragic 5.4% |
| Barbadians | 0.0 /100 | #309 | Tragic 5.5% |
| Immigrants | Barbados | 0.0 /100 | #310 | Tragic 5.5% |
| Chippewa | 0.0 /100 | #311 | Tragic 5.5% |
| Immigrants | Grenada | 0.0 /100 | #312 | Tragic 5.6% |
| Shoshone | 0.0 /100 | #313 | Tragic 5.6% |
| Guyanese | 0.0 /100 | #314 | Tragic 5.6% |
| Immigrants | Dominica | 0.0 /100 | #315 | Tragic 5.6% |
| Immigrants | Guyana | 0.0 /100 | #316 | Tragic 5.6% |
Demographics Similar to Immigrants from Oceania by Unemployment Among Ages 45 to 54 years
In terms of unemployment among ages 45 to 54 years, the demographic groups most similar to Immigrants from Oceania are American (4.4%, a difference of 0.010%), Immigrants from Kazakhstan (4.4%, a difference of 0.010%), Native Hawaiian (4.4%, a difference of 0.050%), Immigrants from Romania (4.4%, a difference of 0.070%), and Immigrants from Asia (4.4%, a difference of 0.090%).
| Demographics | Rating | Rank | Unemployment Among Ages 45 to 54 years |
| Immigrants | Chile | 90.9 /100 | #114 | Exceptional 4.4% |
| Pakistanis | 90.7 /100 | #115 | Exceptional 4.4% |
| Immigrants | North Macedonia | 90.6 /100 | #116 | Exceptional 4.4% |
| South Africans | 90.4 /100 | #117 | Exceptional 4.4% |
| Immigrants | Romania | 90.0 /100 | #118 | Exceptional 4.4% |
| Native Hawaiians | 90.0 /100 | #119 | Excellent 4.4% |
| Americans | 89.6 /100 | #120 | Excellent 4.4% |
| Immigrants | Oceania | 89.5 /100 | #121 | Excellent 4.4% |
| Immigrants | Kazakhstan | 89.5 /100 | #122 | Excellent 4.4% |
| Immigrants | Asia | 88.8 /100 | #123 | Excellent 4.4% |
| Spanish | 88.8 /100 | #124 | Excellent 4.4% |
| Immigrants | Vietnam | 88.6 /100 | #125 | Excellent 4.4% |
| Immigrants | Czechoslovakia | 87.8 /100 | #126 | Excellent 4.4% |
| Nicaraguans | 87.6 /100 | #127 | Excellent 4.4% |
| Immigrants | Northern Europe | 86.9 /100 | #128 | Excellent 4.4% |